- Research article
- Open access
- Published:
A 2700-year record of ENSO and PDO variability from the Californian margin based on coccolithophore assemblages and calcification
Progress in Earth and Planetary Science volume 4, Article number: 5 (2017)
Abstract
The El Niño Southern Oscillation (ENSO) and the Pacific Decadal Oscillation (PDO) account for a large part of modern climate variability. Over the last decades, understanding of these modes of climate variability has increased but prediction in the context of global warming has proven difficult because of the lack of pertinent and reproducible paleodata. Here, we infer the dynamics of these oscillations from fossil assemblage and calcification state of coccolithophore in the Californian margin because El Niño has a strong impact on phytoplankton ecology and PDO on the upwelling intensity and hence on the ocean chemistry. Intense Californian upwelling brings water rich in CO2 and poor in carbonate ions and coccolithophores secrete lower calcified coccoliths. Seasonally laminated sediments of the Santa Barbara Basin are used to document ENSO variability and PDO index for the last 2700 years at a temporal resolution of 3 years. The records present the same characteristics as other PDO or ENSO records from the same area spanning the last centuries. We are therefore confident on the value produced here for the last 2.7 millennia. The records show important centennial variability that is equivalent to solar cycles.
Introduction
El Niño Southern Oscillation (ENSO) and its longer lived cousin, the Pacific Decadal Oscillation (PDO) (Zhang et al. 1997), are the primary sources of global interannual variability. While the ENSO is related to the interconnections between ocean and atmosphere in the tropical eastern Pacific, the PDO is a combination of different physical processes operating on different time scales, including remote tropical forcing (ENSO), oceanic thermal inertia, and atmospheric forcing in response to the Kuroshiyo-Oyashio dynamics (Newman et al. 2016). Yet, their past dynamics remain poorly understood and described. ENSO and PDO act respectively at interannual and decennial scales with variable periods ranging respectively from 2.5 to 7 years and from 20 to 30 years (Mantua et al. 1997; Philander 1983). The impact of ENSO and PDO on the climate of the 20th century, particularly the unusual strong events of 1982–83 and 1997–98 (El Niño) and the climate regime shifts of 1946 and 1977 (PDO), led to a better assessment and understanding of these cycles. However, understanding their changing intensity and frequency during the 21st century is important issues which need to be resolved if we want to predict how these oscillations will be affected by new boundary conditions. By combining recent and past marine sedimentary archives, we aim to monitor the natural variability of these oscillations during the past 2700 years.
The Santa Barbara Basin (SBB) is a sensitive recorder of past climate variability (Behl and Kennett 1996; Biondi et al. 1997; Hendy and Kennett 2000). It is an ideal site to document past variations of ENSO and PDO because of seasonally laminated sediments with excellent preservation during warm periods and high sedimentation rates (Behl and Kennett 1996; Grelaud et al. 2009a). Located in the center of the California Current System (CCS), the SBB is seasonally affected by two opposite currents: the southward California Current (CC) during late spring and summer; and the northward Davidson Current (DC, also known as the California Countercurrent or the California Undercurrent) during late fall and winter. The intensity of these two currents is modulated by the North Pacific High (NPH) and the Aleutian Low (AL). Upwelling activity in the area is related to the strength of the CC, as it brings deeper waters rich in nutriment to the surface. The waters are characterized by low pH and carbonate ion concentrations (Alin et al. 2012). At interannual and decennial scale, ENSO and PDO impact directly the intensity of these atmospheric cells, leading to measurable variations of CC and DC flows (Bograd and Lynn 2001; Chavez et al. 2003). During the cold phases of ENSO or PDO (La Niña or negative PDO), the AL is centered over the northwest Pacific and the NPH intensifies leading to strengthening of the CC, associated upwelling, and a weakening of DC. The opposite occurs during warm phases of ENSO or PDO (El Niño or positive PDO), as the AL strengthens and moves southward over the central Pacific, reducing the intensity of the NPH. ENSO and PDO are modulating the strength of the upwelling system in SBB.
The impact of ENSO and PDO in the SBB is inferred from the interplay of the currents within the CCS whose dynamics can be estimated by carefully analyzing fossil assemblages of microalgae growing in the upper photic zone: the coccolithophores (Calcihaptophycidae, Haptophyta). Their productivity depends directly on the physicochemical characteristics of the CCS. Coccolithophore assemblages are very sensitive to seasonality and can be used to diagnose changes in ENSO as evidenced in 20th century records (De Bernardi et al. 2005; De Bernardi et al. 2008; Grelaud et al. 2008). In some species or group of species, the morphology of the scales constituting their exoskeleton is related to physicochemical parameters of the ocean such as temperature for their size (Bollmann et al. 2002) or concentration in carbonate ion for their mass (Beaufort et al. 2011). We will infer dynamics of the upwelling with this latter parameter. We also present the record of the relative abundances of Gephyrocapsa oceanica (%GEO), a subtropical species characteristic of DC intensity. In the SBB, its abundances are strongly dependent of temperature associated with warm El Niño events (De Bernardi et al. 2005; Grelaud et al. 2008).
Methods/Experimental
The data of coccolithophore assemblages and morphology were extracted from two sedimentary archives retrieved in the SBB: a multi-core was used to cover the last 100 years (BASIN04-1MC3, 2004, 34°13.41′N, 120°01.53′W, 588 m water depth) while a giant piston core was used to cover the last 2.7 kyr (MD02-2503, 2002, 34°17.17′N, 120°02.17 W, 569 m water depth) (Fig. 1). For the chronology of core BASIN04-1MC3, see Grelaud et al. (2009b).

Location of IMAGES VIII core MD02-2503, BASIN 04 MultiCore 1MC3, and ODP Site 893A. The arrows represent the direction of warm (red) and cold (blue) currents and the counterclockwise circulation (black) in the Santa Barbara Basin
The chronology of the MD02-2503 combines five 14C AMS dating and a tuning of its magnetic susceptibility to that of the nearby Ocean Drilling Program (ODP) Site 893A (Grelaud et al. 2009b) (Fig. 1) which combines 25 14C dates in the Holocene (Hendy et al. 2002; Roark et al. 2003). The 3.5 uppermost meters of the MD02-2503, representing the last 2700, were sampled every 0.5 cm leading to a resolution of ~3.6 year. The chronology of this section has been slightly reevaluated from Grelaud et al. (2009b) by using the age model of ODP Site 893A (Schimmelmann et al. 2006) and its revised version (Schimmelmann et al. 2013) (Fig. 2). The synchronization between core MD02-2503 and ODP Site 893 imposes a precision in the chronology of the core MD02-2503 estimated to be around 30 years. With this chronology, the age at the core top is around 1916. The presence at about 20 cm of many shell debris can be attributed to the Macoma event which is dated between 1820 and 1850 (Burke et al. 1996).

Chronology of Core MD02-2503: the magnetic susceptibility of core MD02-2503 (red) (Beaufort et al. 2002) is compared to that of ODP 989 (purple) (Kennett and Ingram 1995) and 7 tie points (blue) are chosen to match the two records. Secondary magnetic susceptibility peaks indicate that this match is precise at +/−5 cm between those tie points. Some minor differences appear between the two records when susceptibility is low; those discrepancies are not used for chronology. 14C dates for MD02-2503 (light blue) and ODP 893 (green) from planktonic foraminifera. In black is the revised varved chronology based on 14C date of terrestrial fossils (Schimmelmann et al. 2013)
The sediment of the upper 3.5 m of Core MD02-2503 is composed in majority of hemipelagic laminated sediments (diatom nannofossil clayey silt and diatom nannofossil silty clay). Eighteen millimetric to centimetric gray layers, representing flood deposits (Behl 1995), were observed within this interval of 3.5 m. The levels at which those layers occur are in good agreement with that found in ODP 893A (Schimmelmann et al. 2006). The coccoliths in those layers are at least 10 times less abundant than in the rest of the core. Although there is no shift in the morphology inside and outside, these layers have been withdrawn from this study. The chronology has been established accordingly, as we consider these layers as geological instantaneous events.
The sample preparation and analyses for coccolithophore assemblages are the same as for Grelaud et al. (2009a): smear slides were prepared according to standard procedure and were analyzed with an automated system of coccoliths recognition (SYRACO, Beaufort and Dollfus 2004; Dollfus and Beaufort 1999). An average of 600 (BASIN04-1MC3) and 900 (MD02-2503) individuals was counted in each samples and 6 species represented more than 96% of the assemblages: Emiliania huxleyi, Florisphaera profunda, Gephyrocapsa ericsonii, Gephyrocapsa muellerae, Gephyrocapsa oceanica, and Helicosphaera carteri.
The average mass of calcite of the coccoliths belonging to the Noelaerhabdaceae family was precisely estimated by using the birefringence properties of the calcite when viewed in cross polarized light and by following the method described by Beaufort (2005).
Results and discussion
-
A
Coccolithophore markers of ENSO
The high-resolution record (four samples per year) of the coccolith assemblages present in core BASIN04 and covering the last 100 years (Grelaud et al. 2009b) indicates that higher relative abundances of G. oceanica are associated with El Niño years (Fig. 3). This relatively warm water species get into the Santa Barbara Basin in higher relative abundance when the California current relaxes (De Bernardi et al. 2005; De Bernardi et al. 2008; Grelaud et al. 2009b). The relative abundances of this species in the sediment of the SBB can be then used to track the occurrence of past El Niño events.
Fig. 3 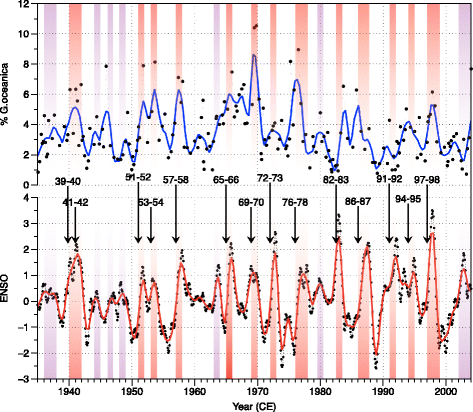
Top: percentage of G. oceanica in the coccolith assemblage in black line with dots. The blue line is the record smoothed by a locally weighted regression (LOESS). Bottom: NINO3 index (black line with dots original—red smoothed (LOESS) record.) (Kaplan et al. 1998; Reynolds et al. 2002) (data available at http://iridl.ldeo.columbia.edu/). Major El Niño events are indicated by numbers, arrows, and orange bands. Minor El Niño by purple bands. (Adapted from Grelaud et al. (2009b))
As the North Pacific Ocean is at the end of the ocean thermohaline circulation system (Broecker and Peng 1982), the upwelled waters in the CCS are rich in CO2 (Feely et al. 2008). During the upwelling season, i.e., in early spring and summer (Pennington and Chavez 2000), surface waters are relatively cold, rich in CO2 and nutrients, low in pH, and poor in oxygen and carbonate ions (Alin et al. 2012). The upwelling is intensified during La Niña and decreased during El Niño events, and these have strong consequences on the water chemistry of the Santa Barbara Basin. For example, the regional average of carbonate ion concentration was lower during the La Niña event of 2008 ([CO3 2−] = 125 μmol kg−1) and higher during the El Niño event of 2006 ([CO3 2−] = 168 μmol kg−1) as reported by CalCOFI hydrographic cruises (2005–2011) (Alin et al. 2012).
When producing their carbonated exoskeleton, coccolithophores are dependent on the carbonate chemistry of the surrounding water (Beaufort et al. 2011; Langer et al. 2006; Langer et al. 2009; Muller et al. 2012; Ridgwell et al. 2009; Riebesell et al. 2000; Rost et al. 2008; Trimborn et al. 2007). We tested here how the seasonal and interannual changes in [CO3 2−] induced by CCS upwelling dynamics impact coccolithophore calcification. Using the data published by Grelaud et al. (2009b), we studied the coccolith mass (CM) of Gephyrocapsa ericsonii, G. muellerae, and Emiliania huxleyi. Gephyrocapsa oceanica being one of the heaviest species belonging to the Noelaerhabdaceae family, any change in relative abundance would have a strong impact on the average mass of the group. In consequence, the mass of G. oceanica was not included in order to have two independent proxies (coccolith mass and percentage of G. oceanica). The differences in coccolith mass are attributed here as the relative abundance of the two E. huxleyi morphotypes that present distinct degree of calcification and that are both abundant in this area: Winter (1985) described in the CCS a heavy form of E. huxleyi referred as «warm» and a light one referred as «cold». Although they were observed living in the same area together, he found «difficult to relate either temperature or salinity alone to placolith type». This early observation by Winter (1985) fits perfectly with the morphometric data we produced here: results show that the coccolith mass, smoothed with a locally weighted regression (LOESS) (Cleveland and Devlin 1988), generally increases during El Niño events (Fig. 4). A general relation between coccolith mass and [CO3 2−] has been established (Beaufort et al. 2011) to express the importance of the ocean carbonate chemistry on the calcification of the Noelaerhabdaceae (the general regression line plotted in (Beaufort et al. 2011) Fig. 1 is [CO3 2−] = 20 × CM + 71.2). The mass is not considered to produce a reliable proxy for past [CO3 2−] as other factor such as temperature, salinity, and nutriment (e.g., Henderiks et al. 2011) may have also influence on the mean coccolith mass. We can use here this relation to check if the measured coccolith mass is in agreement with some known levels of carbonate concentration measured in SBB. In Fig. 4, the upper right axes represent the concentration of carbonate ions in a scale corresponding to the coccolith mass taken from Beaufort et al. (2011). Associated with these axes are the ranges of [CO3 2−] estimated from the CalCOFI hydrographic measurements from the California Current System between 2005 and 2011 (Alin et al. 2012). The green box represents the range obtained during the upwelling season and the red during the no-upwelling season. The red arrow represents the maximal value obtained during an El Niño event and the green arrow the minimal value obtained during a La Niña year. Those ranges are in good agreement with the expected coccolith mass–[CO3 2−] equivalent. Increases of coccolith mass in the SBB can be interpreted as an increase of [CO3 2−] related to a decrease in the intensity of the upwelling during an El Niño event. The anthropogenic input of CO2 in the atmosphere diffuses into the ocean from its surface. In the California Margin, the last time the upwelled waters were exposed to the atmosphere was 50 years ago (Feely et al. 2008). The ocean acidification is therefore somehow delayed in this area and the pH is more dependent on the upwelling activity than on the recent increase of atmospheric CO2. The modulation of El Niño’s by the Pacific Decadal Oscillation appears in this record (Fig. 5): during high PDO’s events (1925–1945 and 1980–2000), the mass of coccolithophores is generally higher than average and the same is also true for secondary events marked by red bands in Fig. 5. The imprint of El Niño on the coccolith mass shades slightly the match between CM and PDO at high frequency. Although the CM and %GEO records result from independent sources, they both increase during El Niño events (Figs. 3 and 4). The two proxies follow slightly differently these climate processes as each responds also differently to other forcing (e.g., nutrient content, seasonal dynamics, cloud cover…).
Fig. 4 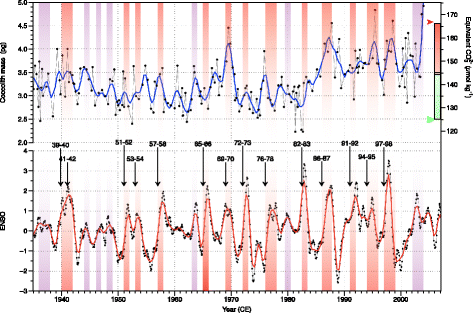
Twentieth century records of the variability of the coccolithophore nannoflora. Top: mean mass in picogram of coccoliths belonging to the species E. huxleyi, G. ericsonii, and G. muellerae in black line with dots. The blue line is smoothed (LOESS) records. The scale on the right represents the concentration in ion bicarbonate equivalent to the coccolith mass from the relation proposed in Beaufort et al. (2011). The boxes associated with these axes are the ranges of [CO3 2−] between 2005 and 2011 (Alin et al. 2012). Green upwelling season, Red no-upwelling season. Red arrowhead represents the maximal value obtained during an El Niño event, and the green arrowhead the minimal value obtained during a La Niña event. Bottom: NINO3 index (black line with dots original—red smoothed (LOESS) record.) (Kaplan et al. 1998; Reynolds et al. 2002) (data available at http://iridl.ldeo.columbia.edu/). Major El Niño events are indicated by numbers, arrows, and orange bands. Minor El Niño by purple bands. (Adapted from Grelaud et al. (2009b))
Fig. 5 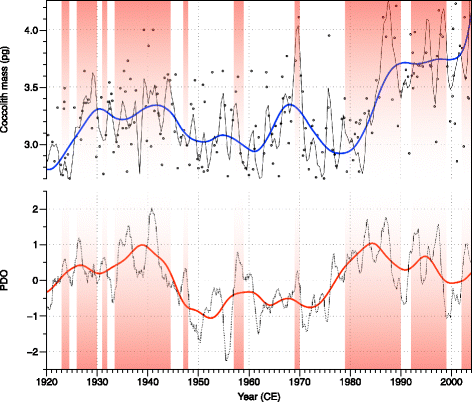
Comparison between the mass of coccoliths of E. huxleyi, G. ericsonii, and G. muellerae (Top) and Pacific Decadal Oscillation (PDO) index (Mantua and Hare 2002). Red bands highlight periods of high PDO
In order to obtain a unique marker of PDO and ENSO in SBB, we propose to combine %GEO and CM because of their visual resemblances. Although they are independent markers, having different units and representing different proxies—one diagnostic of the dynamics of the upwelling (CM), the other of SST (%GEO)—their dynamics has a common forcing that is the PDO-ENSO system. Their combination will allow easier comparison with published variables and pictures in a unique way the dynamics of the ENSO in that region. %GEO and CM were combined by averaging them after standardization (subtracting their average of each variable and by dividing them by their standard deviation. Their sum is divided by two in order to keep the values between −1 and 1:
$$ \mathrm{COCOC} = \left(\left(\%\mathrm{GEO}-\mathrm{mean}\left(\%\mathrm{GEO}\right)\right)/\mathrm{std}\left(\%\mathrm{GEO}\right)\right) + \left(\left(\mathrm{CM}-\mathrm{mean}\left(\mathrm{CM}\right)/\mathrm{std}\left(\mathrm{CM}\right)\right)\right)/2. $$This new combined marker is labeled COCOC that stands for combined coccolith proxies. It features the common variations of the two proxies, for example, COCOC will increase significantly during %GEO and CM common rise.
-
B
Coccolithophores, assemblages, and morphometry during the last 2700 years
The morphometric (CM) and assemblage (%GEO) records of coccoliths are both showing similar rapid changes as well as a long-term decrease over the last 2700 years (Fig. 6). The polynomial regressions presented in Fig. 6 indicate that the coccolith mass and the relative abundance of G. oceanica gradually decreased from about 3.65 pg and 4% respectively (2700 years ago) to about 3.2 pg and 1.5% between 1400 and 1800. This could be attributed to a predominantly negative phase of the PDO; however, as the decrease is more pronounced in %GEO than that in CM, it more certainly results from a decrease in sea surface temperature (SST) during that time. Such decrease has already been documented in many parts of the ocean including the SBB (McGregor et al. 2015). The relation between SST and %GEO is confirmed by the comparison, over the last 700 years, of our results with a high-resolution record of alkenones measured at ODP Site 893 in the SBB (Zhao et al. 2000). Both records are presented in Fig. 7 according to the revised chronology (Schimmelmann et al. 2013). The smoothed (LOESS) records reveal a common regularity of the centennial variability in both records (Fig. 7). The cross spectral analysis (Blackman-Tukey) performed on the two time series shows that the coherency between SST and %GEO for the last 700 years is significant (P > 0.95) at three frequencies (1/118, 1/36, and ~1/23 years−1) and relatively in phase (within the chronological constraint) between the two records (Fig. 8). The 23 year period is often reported for the PDO (Biondi et al. 2001; Biondi et al. 1997; Minobe 1999). Although at its lower range, the 36 year period could be assimilated to the pentadecadal (30–70 years) PDO variability (Minobe 1999). The significant relation between SST and %GEO confirms that %GEO can be used to diagnose SST evolution in the SBB. The presence of those frequencies in the time series shows the constant feature of the PDO over the last 700 years. The imprint of the PDO on the upwelling and SST of SBB confirms that it is an important factor of SST variability in this region (Biondi et al. 1997). Although, in some rare parts of the records, a divergence appears: for example, in year 450, %GEO peaks higher than CM. We do not have explanation for those differences that reflect the complex response of an ecological system to climate.
Fig. 6 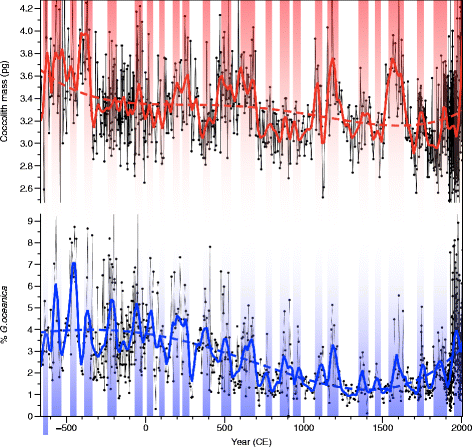
Two thousand and seven hundred-year records of variability of the coccolithophore nannoflora. Top—red: coccolith mass of E. huxleyi, G. ericsonii, and G. muellerae. Bottom—blue: relative abundance of G. oceanica. Colored lines represent the LOESS function and the dotted lines represent polynomial of fourth order to depict the long-term tendencies. Vertical colored bars are synchronous events common to the two series
Fig. 7 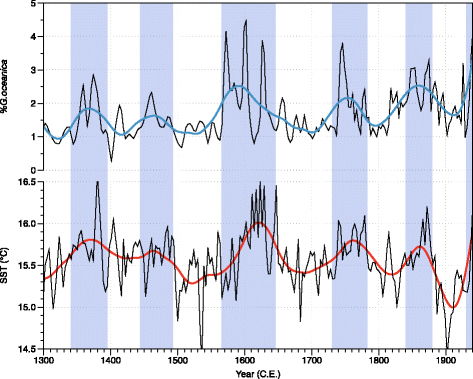
Comparison of the abundance of G. oceanica and SST for the last 700 years. Top: Records of %G. oceanica. Bottom: SST (UK37 from Zhao et al. (2000)). Both records are from the same position in the Santa Barbara Basin. Colored lines represent the LOESS smoothing function for the two series. Vertical bands are long-term increases of temperature detected by the two proxies
Fig. 8 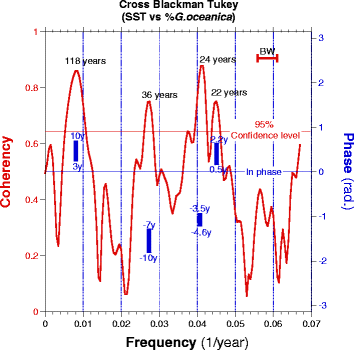
Cross spectral analysis (Blackman-Tukey) between the 700 year record of SST (Zhao et al. 2000) and %G. oceanica in the Santa Barbara Basin. No-Zero coherence at 95% is higher than a confidence level of 0.665 (red horizontal line). The bandwidth is 0.0046 (red horizontal bar marked BW). Lengths of significant periods are indicated in the graph. For those, the phase between the two series is indicated by vertical blue lines representing the phase error bar at 80% with the upper and lower limits expressed in years. The horizontal blue line is the zero phase. For positive phase value, SST is leading and for negative phase values, %G. oceanica is leading
Increases of CM or %G. oceanica occur synchronously in both records at a regular centennial pacing (Figs. 6 and 9). The centennial variability is well expressed and highly coherent. The records, smoothed with a LOESS, reveal the regularity of the centennial variability (Fig. 9). The regular peaks of %GEO and CM covering the last 2700 year depict the alternation of sustained phases of ENSO-like and/or PDO conditions at centennial scale. Singular spectrum analysis (SSA) (Vautard and Ghill 1989) is performed on the composite record COCOC to determine the relative importance in the total variance of those differences of frequency components. The time series is decomposed in forty independent principal components (PC). The first PC (PC1) contains 46.3% of the total variance; PC2, 8.9%; PC3, 5.2%; and all the other PCs (4 to 40) together, 39.6%. The first three PCs capture more than half of the variance as it is shown in Fig. 12. PC2 appears to fluctuate at about 200 years periodicity and PC3 with pseudoperiods centered on 100 years. Higher important frequencies are centered on period of 30 years (Fig. 10). The strongest PDO+ events and in a lesser extent the strongest PDO− events appear during times of high values of the PC2 (Fig. 11). This indicates that the centennial variability acts also as a modulator of the PDO variability and/or that during an increase of centennial mean of PDO, the negative PDO events remain strong. In other words, the amplitude of PDO cycle increases during centennial “warm” events.
Fig. 9 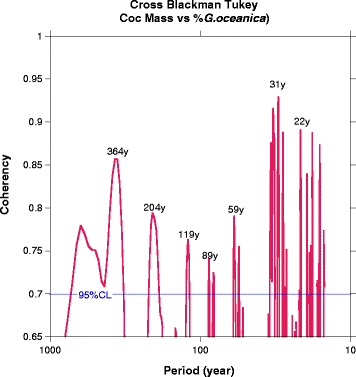
Cross spectral analysis (Blackman-Tukey) between the 2700 year records of coccolith mass of (Gephyrocapsa ericsonii, G. muelerae, E. huxleyi) and %G. oceanica in the Santa Barbara Basin. No-Zero coherence at 95% is higher than a confidence level of 0.705 (blue horizontal line). The bandwidth is 0.00093. Lengths of significant periods are indicated in the graph
Fig. 10 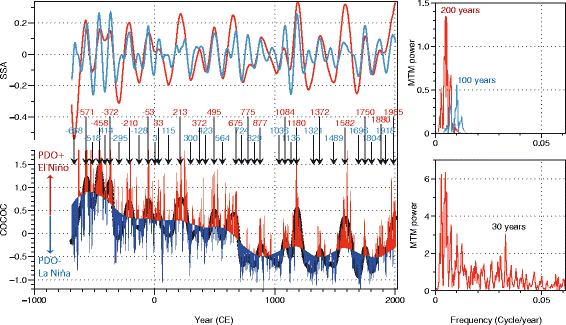
Variability of the COCOC (composite coccolith proxy) during the last 2700 years in the Santa Barbara Basin. Bottom left panel shows the COCOC record in red and blue color, the limit between red and blue is a detrended COCOC record by the 1st PC of a SSA (Vautard and Ghill 1989) and the 2nd PC of a SSA (the embedding dimension is 40) in black dotted line. Top left panel represents the 2nd (red) and 3rd (blue) PCs of the SSA. The dates of each minima (blue text) and maxima (red text) of the 2nd PC are given. Right panels represent the spectral analysis performed with the Multi-Taper Method (Thomson 1982) of the 2nd PC (red in top panel), 3rd PC (blue), and the COCOC record detrended with the 1st PC (red in the bottom panel). The principal period is given in year
Fig. 11 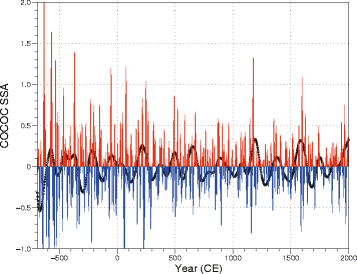
Modulation of the multi-decadal amplitude of COCOC by its centennial to bicentennial scale variability: The red and blue lines represent all the PCs higher than 4 (e.g., mutli-decadal amplitude), and the dotted black line the two PC (centennial to bicentennial variability)
Such a centennial variability is observed in the derivative δ18O from Pyramid Lake, Nevada, (Benson et al. 2002) and is characteristic of drought occurrences over western USA. The long-term tendency is also similar between the records (see polynomials in Fig. 12). Each of the 17 episodes of drought occurring with a pseudoperiod of 150 year described in Benson et al. (2002) for the last 2700 years corresponds to decreases of %GEO and CM (Fig. 12) (albeit a shift of 50 years probably due to difference in record chronology). This relation may be interpreted as a weakening of the DC, presumably related to La Niña-like conditions. Sustained La Niña-like conditions and associated changes in PDO appear to drive the drought periods over the western USA.
Fig. 12 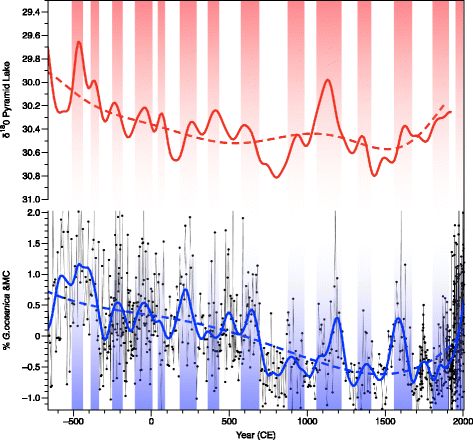
Two thousand and seven hundred-year records in the top panel and in red, the smoothed (10 year) record of δ18O record in core PLC97-1 from Pyramid Lake (Benson et al. 2002) shifted (arbitrarily) by +50 years, and in the bottom panel and in blue, the COCOC record. The blue solid line represents the LOESS function. The colored dotted lines represent polynomial of fourth order to depict the long-term tendencies. Vertical colored bars are events common to the two series
PDO is a complex combination of different dynamical parameters (Newman et al. 2016). The different published PDO proxies (e.g., Benson et al. 2003; MacDonald and Case 2005, COCOC) are responding mainly to one of the dynamical parameter and do not necessarily englobe the entire complexity of PDO. This explains some differences existing between all these PDO reconstructions.
Cross spectral analysis of %GEO versus CM reveals pseudoperiodicity around 100 and 200 years (Fig. 9). Those records are highly coherent with each other and with that of δ18O from Pyramid Lake, pointing to the highest coherency (>95%) at frequencies of 1/213, 1/193, and 1/96 years−1. These frequencies are also very similar to those commonly cited as de Vries or Suess (~1/200 year−1) and Geisberg (1/83 year−1) cycles found in cosmogenic (14C and 10Be) records (e.g., Emile-Geay et al. 2007; Neftel et al. 1981; Ogurtsov et al. 2002; Suess 1980). Similar cycles are also found in records of the PDO (Benson et al. 2003) and of the Pacific-North American teleconnection pattern (PNA) (Liu et al. 2014; Steinman et al. 2012). This similarity of the variability points to an influence of solar radiation on the ENSO. Mann et al. (2005) studied the importance of volcanic activity and solar irradiance on the ENSO dynamics for the last 1000 years by using Zebiak and Cane (1987) model of the tropical Pacific coupled ocean–atmosphere system. In this model, ENSO reacts to solar irradiance due to a zonal asymmetry in the response of the tropical pacific: a heating due to higher irradiance would cool the East Pacific, inducing a La Niña-like climatic system.
Such climatic variability appears to be coherent with the amount of heat received by the Earth from the sun: an apparent relation exists between these data and those of the total solar irradiance anomalies (TSIa). Phases of La Niña-like and associated drought conditions over western USA coincide with decrease or negative values of TSIa. Direct solar irradiance including also volcanic activity is controlling ENSO (Liu et al. 2015) by playing a role in the energy received at the ocean level: the influence of both solar irradiance and volcanic activity on ENSO has been tested by numerical simulations (Mann et al. 2005). The results of those simulations have been compared visually to the composite of the coccolithophore records. This indicates that the ENSO simulation with the solar irradiance as sole forcing exhibits synchronous events with coccolithophore record (COCOC) (Fig. 13); the ENSO simulation using both solar irradiance and volcanic activity hardly shows any similarity with coccolithophore records (Fig. 13). This could be indicative that solar activity is responsible in a large part of the ENSO and PDO dynamics and that volcanic activity as limited impact on PDO/ENSO dynamics. This is even further demonstrated by the lack of synchronism between the timing of the large PDO events found in the COCOC record and the timing of the major volcanic eruptions occurred during the last 2500 years described by Sigl et al. (2015). This would explain why there is stable centennial variability similar to that of the solar cycle (knowing that volcanic activity should not be cyclic). The persistence of quasi-bicentennial cycle during the entire Holocene in the North America has been recently described elsewhere (Liu et al. 2014) and confirms the permanence of the centennial to bicentennial dynamics in the eastern Pacific and North America.
Fig. 13 
One thousand-year records in the top panel and in red, the COCOC record, and in the bottom panel and in blue, the smoothed (40 year) record of the simulations (ensemble of 100 realizations with the Zebiak and Cane model) of NINO3 to solar radiative forcing in blue and to volcanic and solar radiative forcing (black dotted line) adapted from Mann et al. (2005). The colored solid lines represent the LOESS functions of those records. Vertical colored bars are events common to the two series


Conclusions
We presented here two 2700 years' long records from the Santa Barbara Basin of ENSO/PDO proxies based on coccolithophores: one resulting from the relative abundance in the assemblage of one warm species Gephyrocapsa oceanica and the other from the degree of calcification of a group of three abundant species (Emiliania huxleyi, G. ericsonii, G. muellerae). The first proxy appears to be related primarily to SST changes and to ENSO, and the second proxy is more related to the dynamics of the upwelling and on PDO. Although the two proxies are independent, they show similar dynamics:
-
1.
A general decrease (in abundance and mass) over the last millennia until 300 years ago. Since then, the values increase. This recent increase is particularly pronounced for the mass values that show the highest in the 2700 record in the last 30 years. This general trend is in accordance with the general decrease of SST in the ocean and in particular in the coast of California (McGregor et al. 2015). The impact of ocean acidification in the most recent part of the record may be limited because the relatively old waters upwelled in this area delay the drop of pH by 50 years (Feely et al. 2008).
-
2.
In addition to this long-term variation, there is a strong variability at multi-decadal (periods of 23 and 39 years), centennial, and bicentennial that are typical of ENSO and PDO in that region. The multi-decadal amplitude is modulated by the centennial/bicentennial variability, implying that both phases (negative and positive) of the PDO are increased during high mean COCOC value events at centennial to bicentennial scale.
The presence in those records of de Vries or Suess (~1/200 year−1) and Geisberg (1/83 year−1) cycles that are associated to solar radiation is indicative of the radiative forcing as an important factor of climatic variability in the eastern Pacific regions.
Abbreviations
- AL:
-
Aleutian Low
- CC:
-
California Current
- CCS:
-
California Current System
- CM:
-
Coccolith mass
- COCOC:
-
Composite coccoliths records
- DC:
-
Davidson Current
- ENSO:
-
El Niño Southern Oscillation
- NPH:
-
North Pacific High
- PDO:
-
Pacific Decadal Oscillation
- SBB:
-
Santa Barbara Basin
References
Alin SR, Feely RA, Dickson AG, Martin Hernandez-Ayon J, Juranek LW, Ohman MD, Goericke R (2012) Robust empirical relationships for estimating the carbonate system in the southern California Current System and application to CalCOFI hydrographic cruise data (2005–2011). J. Geophys. Res.-Oceans 117. doi:10.1029/2011JC007511
Beaufort L (2005) Weight estimates of coccoliths using the optical properties (birefringence) of calcite. Micropaleontol 51:289–298
Beaufort L, the members of the scientific party (2002) MD126 MONA (Marges Ouest Nord Americaines) IMAGES VIII. Insitut Polaire Francais Paul Emile Victor (IPEV), Brest, p 453
Beaufort L, Dollfus D (2004) Automatic recognition of coccolith by dynamical neural network. Mar Micropaleont 51/1-2:57–73
Beaufort L, Probert I, de Garidel-Thoron T, Bendif EM, Ruiz-Pino D, Metzl N, Goyet C, Buchet N, Coupel P, Grelaud M, Rost B, Rickaby REM, de Vargas C (2011) Sensitivity of coccolithophores to carbonate chemistry and ocean acidification. Nature 476:80–84
Behl RJ. (1995) Sedimentary Facies and Sedimentology of the Late Quaternary Santa Barbara Basin, Site 893. In: Kennett JP, J.G. B, Lyle M (eds). Proceedings of the Ocean Drilling Program, Scientific Results, vol. 146. Ocean Drilling Program, College Station, pp 295–308
Behl RJ, Kennett JP (1996) Brief interstadial events in the Santa Barbara Basin, NE Pacific, during the past 60 kyr. Nature 379:243–246
Benson L, Kashgarian M, Rye R, Lund S, Paillet F, Smoot J, Kester C, Mensing S, Meko D, Lindstrom S (2002) Holocene multidecadal and multicentennial droughts affecting Northern California and Nevada. Quat Sci Rev 21:659–682
Benson L, Linsley B, Smoot J, Mensing S, Lund S, Stine S, Sarna-Wojcicki A (2003) Influence of the Pacific Decadal Oscillation on the climate of the Sierra Nevada, California and Nevada. Quat Res 59:151–159
Biondi F, Lange CB, Hughes MK, Berger WH (1997) Inter-decadal signals during the last millennium (AD 1117–1992) in the varve record of Santa Barbara basin, California. Geophys Res Lett 24:193–196
Biondi F, Gershunov A, Cayan DR (2001) North Pacific decadal climate variability since 1661. J Clim 14:5–10
Bograd SJ, Lynn RJ (2001) Physical-biological coupling in the California Current during the 1997–99 El Nino-La Nina cycle. Geophys Res Lett 28:275–278
Bollmann J, Henderiks J, Brabec B (2002) Global calibration of Gephyrocapsa coccolith abundance in Holocene sediments for paleotemperature assessment. Paleoceanogr 17:10.1029
Broecker W, Peng TH (1982) Tracer in the sea. Columbia University, New-York
Burke S, Dunbar R, Berger W (1996) Benthic and pelagic Foraminifera of the Macoma layer, Santa Barbara Basin. Oceanogr Lit Rev 1:64–65
Chavez FP, Ryan J, Lluch-Cota SE, Niquen M (2003) From anchovies to sardines and back: multidecadal change in the Pacific Ocean. Science 299:217–221
Cleveland WS, Devlin SJ (1988) Locally weighted regression: an approach to regression analysis by local fitting. J Am Stat Assoc 83:596–610
De Bernardi B, Ziveri P, Erba E, Thunell RC (2005) Coccolithophore export production during the 1997–1998 El Nino event in Santa barbara basin (California). Mar Micropaleontol 55:107–125
De Bernardi B, Ziveri P, Erba E, Thunell RC (2008) Calcareous phytoplankton response to the half century of interannual climatic variability in Santa Barbara Basin (California). Paleoceanography 23. doi:10.1029/2007pa001503
Dollfus D, Beaufort L. (1999) Fat neural network for recognition of position-normalised objects. Neural Networks 12:553–560
Emile-Geay J, Cane M, Seager R, Kaplan A, Almasi P (2007) El Niño as a mediator of the solar influence on climate. Paleoceanography 22. 10.1029/2006PA001304
Feely RA, Sabine CL, Hernandez-Ayon JM, Ianson D, Hales B (2008) Evidence for upwelling of corrosive “acidified” water onto the continental shelf. Science. 320:1490–1492
Grelaud M, Schimmelmann A, Beaufort L (2008) Coccolithophore response to climate and surface hydrography in Santa Barbara Basin, California, AD 1917–2004. Biogeosciences Discuss 5:4129–4159
Grelaud M, Schimmelmann A, Beaufort L (2009a) Coccolithophore response to climate and surface hydrography in Santa Barbara Basin, California, AD 1917–2004. Biogeosciences 6:2025–2039
Grelaud M, Beaufort L, Cuven S, Buchet N (2009b) Glacial to interglacial primary production and El Nino—Southern Oscillation dynamics inferred from coccolithophores of the Santa Barbara Basin. Paleoceanography 24(PA1203):1201–1215
Henderiks J, Winter A, Elbrächter M, Feistel R, Van der Plas A, Nausch G, Barlow R (2011) Environmental controls on Emiliania huxleyi morphotypes in the Benguela coastal upwelling system (SE Atlantic). Mar Ecol Prog Ser 448:51–66
Hendy IL, Kennett JP (2000) Dansgaard-Oeschger cycles and the California Current System: planktonic foraminiferal response to rapid climate change in Santa Barbara Basin, Ocean Drilling Program Hole 893A. Paleoceanography 15:30–42
Hendy IL, Kennett JP, Roarkc EB, Ingramc BL (2002) Apparent synchroneity of submillennial scale climate events between Greenland and Santa Barbara Basin, California from 30–10 ka. Quat Sci Rev 21:1167–1184
Kaplan A, Cane MA, Kushnir Y, Clement AC, Blumenthal MB, Rajagopalan B (1998) Analyses of global sea surface temperature 1856–1991. J Geophys Res Oceans 103:18567–18589
Kennett J, Ingram B (1995) Paleoclimatic evolution of Santa Barbara basin during the last 20 kyr: marine evidence from Hole 893A. Proc Ocean Drill Program Sci Results 146(Part 2):309–325
Langer G, Geisen M, Baumann K-H, Kläs J, Riebesell U, Thoms S, Young JR (2006) Species-specific responses of calcifying algae to changing seawater carbonate chemistry. Geochem Geophys Geosyst 7:Q09006
Langer G, Nehrke G, Probert I, Ly J, Ziveri P (2009) Strain-specific responses of Emiliania huxleyi to changing seawater carbonate chemistry. Biogeosci Discuss 6:4361–4383
Liu Z, Yoshimura K, Bowen GJ, Buenning NH, Risi C, Welker JM, Yuan F (2014) Paired oxygen isotope records reveal modern North American atmospheric dynamics during the Holocene. Nat Commun 5. doi:10.1038/ncomms4701
Liu F, Chai J, Huang G, Liu J, Chen ZY (2015) Modulation of decadal ENSO-like variation by effective solar radiation. Dyn Atmos Oceans 72:52–61
MacDonald GM, Case RA (2005) Variations in the Pacific Decadal Oscillation over the past millennium. Geophys Res Lett 32:4
Mann ME, Cane MA, Zebiak SE, Clement A (2005) Volcanic and solar forcing of the tropical Pacific over the past 1000 years. J Clim 18:447–456
Mantua NJ, Hare SR (2002) The Pacific decadal oscillation. J Oceanogr 58:35–44
Mantua NJ, Hare SR, Zhang Y, Wallace JM, Francis RC (1997) A Pacific interdecadal climate oscillation with impacts on salmon production. Bull Am Meteorol Soc 78:1069–1079
McGregor HV, Evans MN, Goosse H, Leduc G, Martrat B, Addison JA, Mortyn PG, Oppo DW, Seidenkrantz M-S, Sicre M-A, Phipps SJ, Selvaraj K, Thirumalai K, Filipsson HL, Ersek V (2015) Robust global ocean cooling trend for the pre-industrial Common Era. Nat Geosci 8:671–677
Minobe S (1999) Resonance in bidecadal and pentadecadal climate oscillations over the North Pacific: role in climatic regime shifts. Geophys Res Lett 26:855–858
Muller MN, Beaufort L, Bernard O, Pedrotti ML, Talec A, Sciandra A (2012) Influence of CO2 and nitrogen limitation on the coccolith volume of Emiliania huxleyi (Haptophyta). Biogeosciences 9:4155–4167
Neftel A, Oeschger H, Suess HE (1981) Secular non-random variations of cosmogenic carbon-14 in the terrestrial atmosphere. Earth Planet Sci Lett 56:127–147
Newman M, Alexander MA, Ault TR, Cobb KM, Deser C, Di Lorenzo E, Mantua NJ, Miller AJ, Minobe S, Nakamura H (2016) The Pacific decadal oscillation, revisited. J Clim 29:4399–4427
Ogurtsov M, Nagovitsyn YA, Kocharov G, Jungner H (2002) Long-period cycles of the Sun’s activity recorded in direct solar data and proxies. Sol Phys 211:371–394
Pennington JT, Chavez FP (2000) Seasonal fluctuations of temperature, salinity, nitrate, chlorophyll and primary production at station H3/M1 over 1989–1996 in Monterey Bay, California. Deep-Sea Res II Top Stud Oceanogr 47:947–973
Philander SGH (1983) El Niño Southern Oscillation phenomena. Nature 302:295–301
Reynolds RW, Rayner NA, Smith TM, Stokes DC, Wang W (2002) An improved in situ and satellite SST analysis for climate. J Clim 15:1609–1625
Ridgwell A, Schmidt DN, Turley C, Brownlee C, Maldonado MT, Tortell P, Young J (2009) From laboratory manipulations to Earth system models: scaling calcification impacts of ocean acidification. Biogeosciences 6:2611–2623
Riebesell U, Zondervan I, Rost B, Tortell PD, Zeebe R, Morel FM (2000) Reduced calcification of marine plankton in response to increased atmospheric CO2. Nature 407:364–367
Roark EB, Ingram BL, Southon J, Kennett JP (2003) Holocene foraminiferal radiocarbon record of paleocirculation in the Santa Barbara Basin. Geology 31:379–382
Rost B, Zondervan I, Wolf-Gladrow DA (2008) Sensitivity of phytoplankton to future changes in ocean carbonate chemistry: current knowledge, contradictions and research directions. Mar Ecol Prog Ser 373:227–237
Schimmelmann A, Lange CB, Roark EB, Ingram BL (2006) Resources for paleoceanographic and paleoclimatic analysis: a 6,700-year stratigraphy and regional radiocarbon reservoir-age (ΔR) record based on varve counting and 14C-AMS dating for the Santa Barbara Basin, offshore California, USA. J Sediment Res 76:74–80
Schimmelmann A, Hendy IL, Dunn L, Pak DK, Lange CB (2013) Revised ∼2000-year chronostratigraphy of partially varved marine sediment in Santa Barbara Basin, California. GFF 135:258–264
Sigl M, Winstrup M, McConnell JR, Welten KC, Plunkett G, Ludlow F, Buntgen U, Caffee M, Chellman N, Dahl-Jensen D, Fischer H, Kipfstuhl S, Kostick C, Maselli OJ, Mekhaldi F, Mulvaney R, Muscheler R, Pasteris DR, Pilcher JR, Salzer M, Schupbach S, Steffensen JP, Vinther BM, Woodruff TE (2015) Timing and climate forcing of volcanic eruptions for the past 2,500 years. Nature 523:543–549
Steinman BA, Abbott MB, Mann ME, Stansell ND, Finney BP (2012) 1500 year quantitative reconstruction of winter precipitation in the Pacific Northwest. Proc Natl Acad Sci 109:11619–11623
Suess HE (1980) The radiocarbon record in tree rings of the last 8000 years. Radiocarbon 22:200–209
Thomson DJ (1982) Spectrum estimation and harmonic analysis. Proc IEEE 70:1055–1096
Trimborn S, Langer G, Rost B (2007) Effect of varying calcium concentrations and light intensities on calcification and photosynthesis in Emiliania huxleyi. Limnol Oceanogr 52:2285–2293
Vautard R, Ghill M (1989) Singular spectrum analysis in nonlinear dynamics, with applications to paleoclimatic time series. Physica D 35:395–424
Winter A (1985) Distribution of living coccolithophores in the California current system, Southern California borderland. Marine Microplaleontol 9:385–393
Zebiak SE, Cane MA (1987) A model El Niño-Southern Oscillation. Mon Weather Rev 115:2262–2278
Zhang Y, Wallace JM, Battisti DS (1997) ENSO-like interdecadal variability: 1900–93. J Clim 10:1004–1020
Zhao M, Eglinton G, Read G, Schimmelmann A (2000) An alkenone (U37K′) quasi-annual sea surface temperature record (A.D. 1440 to 1940) using varved sediments from the Santa Barbara Basin. Org Geochem 31:903–917
Acknowledgements
We thank the IMAGES program, IPEV, and the crew of the RV Marion-Dufresne for retrieving the core MD02-2503. LB gratefully acknowledges the invitation and support by Pr Masanobu Yamamoto to participate to the INQUA 2015 symposium held in Nagoya, Japan.
Funding
We thank the Agence Nationale de la Recherche for its financial support to LB under projects ANR‐12-BS06‐0007–CALHIS and JPI Blemont project ANR-15-JCLI-0003-05–PACMEDY. This work is a contribution to the EU FP7 project MedSeA (grant agreement no. 265103).
Authors’ contributions
LB proposed the topic. MG carried out the experimental study. LB and MG interpreted the data. LB wrote the first drafts of the manuscript and both approved the final manuscript.
Competing interests
The authors declare that they have no competing interests.
Publisher’s Note
Springer Nature remains neutral with regard to jurisdictional claims in published maps and institutional affiliations.
Author information
Authors and Affiliations
Corresponding author
Rights and permissions
Open Access This article is distributed under the terms of the Creative Commons Attribution 4.0 International License (http://creativecommons.org/licenses/by/4.0/), which permits unrestricted use, distribution, and reproduction in any medium, provided you give appropriate credit to the original author(s) and the source, provide a link to the Creative Commons license, and indicate if changes were made.
About this article

Cite this article
Beaufort, L., Grelaud, M. A 2700-year record of ENSO and PDO variability from the Californian margin based on coccolithophore assemblages and calcification. Prog. in Earth and Planet. Sci. 4, 5 (2017). https://doi.org/10.1186/s40645-017-0123-z
Received:
Accepted:
Published:
DOI: https://doi.org/10.1186/s40645-017-0123-z