- Review
- Open access
- Published:
Earthquake early warning: what does “seconds before a strong hit” mean?
Progress in Earth and Planetary Science volume 5, Article number: 63 (2018)
Abstract
An earthquake early warning (EEW) system is designed to detect an event, determine its parameters (hypocenter, magnitude, and origin time), and issue an alert to sites/areas where necessary actions should be taken before destructive seismic energy arrivals. At present, large-scale EEW systems are operational in several countries around the world. The most extensive nationwide EEW system has been operating in Japan since 2007, and was able to issue alerts broadly when the moment magnitude (Mw) 9 Tohoku-Oki earthquake hit in 2011. The casualties caused by this event were far less than those caused by other deadly earthquakes (Mw > 6.6) in this century. Many other countries attributed the fewer death victims to the advanced large-scale EEW system, and plan to install systems similar to Japan’s model. However, the historical and environmental background in Japan, both in terms of earthquake hazards and safety preparation, differs considerably from other countries. In addition, EEW systems that use data from a large-scale network (i.e., “a big-net” hereafter) still have limitations. There are thus numerous factors that other countries should consider to benefit from installing a Japan-styled EEW. In this article, we review how research and development associated with EEW have been carried out, and how EEW systems presently function. We then show short-wavelength variation of ground motions within the typical station interval of a big-net using data recorded by a dense local seismic network in Japan. However, it is not particularly meaningful to attempt detailed modeling of varieties of ground motion within the station interval for a big-net EEW operation, because the possible combinations of earthquake sources, paths of wave propagation, and recipient sites are infinite. We emphasize that in all circumstances, for recipients to benefit from EEW, seismic safety preparations must be implemented. Necessary preparations at sites do not diminish in importance after incremental improvements in station coverage and/or algorithms in a big-net operation. Further, scientists and engineers involved in EEW projects should strive to publically disseminate how big-net EEW systems work, and also why, to achieve maximum benefit, these systems should always be supplemented by preparations at recipients’ sites.
Introduction
Earthquakes have caused the worst natural disasters repeatedly. In the twenty-first century alone, there were a number of catastrophic earthquakes that destroyed human lives and environments. Table 1 shows the seven deadliest earthquakes that occurred with casualties of over 10,000 in the twenty-first century. The public wishes that destructive earthquakes could be predicted in advance. There are many networks of seismic instruments on various scales, which were installed in an attempt to observe precursory phenomena of earthquakes around the world. At present, however, it is not possible to forecast the location, time, and size of an earthquake before its occurrence. On the other hand, once an earthquake takes place, a large-scale real-time monitoring network installed to monitor seismic activity in a broad region can detect it, and its earthquake early warning (EEW) system (referred to as a big-net EEW system hereafter) can issue an alert to affected areas through various media seconds before strong ground shaking arrives. At present, there are big-net EEW systems operational in several countries. The system in Japan that the Japan Meteorological Agency (JMA) began operating in 2007 consists of over 4000 contributing stations, with a typical station interval of about 20 km over the country, and has the most extensive record for EEW performance.
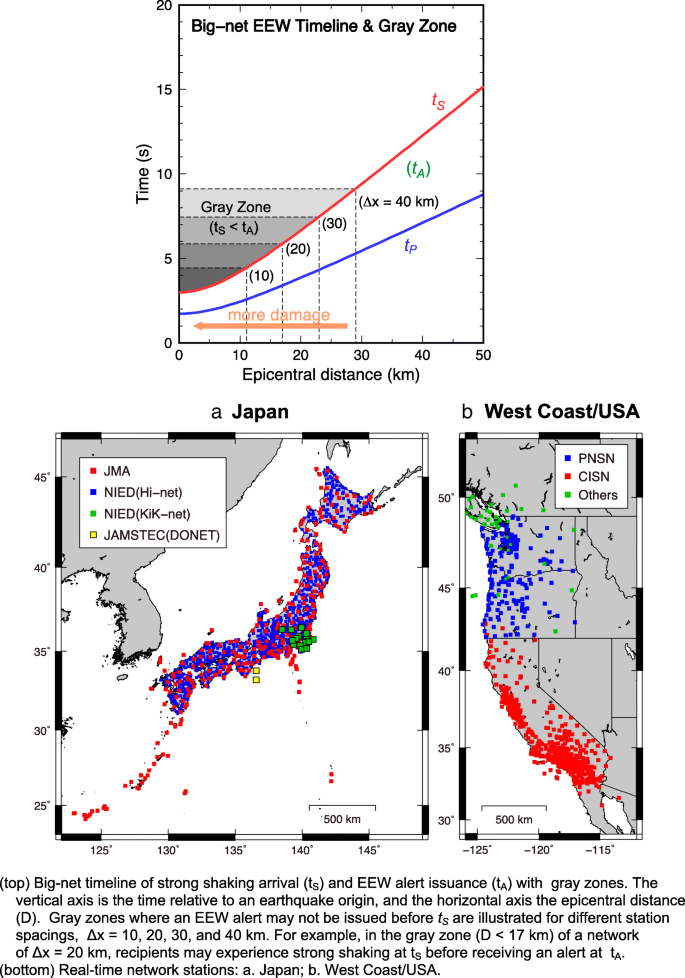
End-users/recipients in public may expect to receive an alert from a big-net system before strong ground shaking and so be able to take effective actions. Here, they should be aware of the timeline of receiving an alert and actual ground motion arrival at their sites, which is illustrated relative to an earthquake occurrence in Fig. 1. Once an earthquake occurs in the area covered by a dense seismograph network, the EEW system detects P-waves from the earthquake and determines preliminary parameters (hypocenter, magnitude, and origin time) using data at three or more stations. If the estimated intensity exceeds a certain level, the system may issue an alert to affected areas (see the explanation of the EEW system; Hoshiba et al. (2008) and Allen et al. (2009)). It should be noted that the warning time, which is the interval between alert issuance at tA and actual ground motion arrival by S-waves at tS, has to be sufficient for recipients to take effective actions.

Big-net EEW timeline of strong shaking arrival and gray zones for different station intervals. This example is illustrated for an event which occurs at a depth of 10 km. The vertical axis shows the elapsed time (s) from the earthquake origin time, and the horizontal axis the epicentral distance (D, in km). The travel time curves for P- and S-waves (denoted tP and tS) are drawn in blue and red as a function of epicentral distance, assuming 5.8 km/s for P-wave speed and 3.4 km/s for S-wave speed for the uppermost layer from the iasp91 model (Kennett and Engdahl 1991). A gray zone is the area where strong ground shaking arrives with S-wave at tS before an EEW alert at tA, (i.e., tS < tA), and its size depends on the network station interval (Δx) and system processing time. Here, gray zones are shown in different shades for different station spacings, Δx = 10, 20, 30, and 40 km, assuming the system processing time of 2 s after P-wave detection at three or more stations. The maximum Ds of the corresponding gray zones are ~ 11 km, ~ 17 km, ~ 23 km, and ~ 29 km, respectively. Outside gray zones, there is a warning time of tS - tA (> 0 s). The further the site is from the epicenter, the longer the warning time is. On the other hand, the ground shaking is stronger and more damage may be caused in the gray zone than outside the zone
However, an alert from a big-net EEW system might not be delivered to areas within a certain epicentral distance (D) before strong ground shaking arrives. This is called a “gray zone” in a big-net system. The gray zone size depends on the network station spacing (Δx) and system processing time. Figure 1 illustrates the timeline of strong motion arrival by S-wave as a function of D, and gray zones (shown in different shades) where strong shaking arrives before an alert, for Δx = 10, 20, 30, and 40 km, respectively, assuming an earthquake depth of 10 km and a process time of 2 s. The larger the station spacing (Δx) is, the larger the gray zone is because of a longer event detection time. For example, in the area that is covered by a network of Δx = 20 km, strong ground shaking may start at a location of D < 17 km before an alert is issued from the EEW system. In the gray zone, the ground shaking is likely to be stronger, causing more damage than outside of it. If the alert is not delivered before a strong hit, it is not useful at the recipient site.
As is seen in Table 1, the casualties caused by earthquakes in this century are not proportional to magnitudes. The 2010 Mw7 Haiti earthquake caused the most casualties (up to ~ 316,000). In comparison, the total casualties by the 2011 Mw9 Tohoku-Oki earthquake were about 18,500, of which victims of building collapses or landslides due to strong shaking were 4.4% of the total, most of the victims succumbing to tsunamis (Cabinet Office 2011). When this earthquake occurred offshore of northeastern Japan (~ 100 km from the coast), the nationwide EEW system detected P-waves ~ 22 s after its rupture onset and issued the initial alert to affected areas in ~ 8 s. Since the system was made available to the public in 2007, this was the first major event, about which many in public broadly received alerts through various media seconds before strong ground shaking.
The JMA EEW system issues an alert when it detects an event with an estimated maximum JMA intensity (IJMA) of 5− or larger (see the method for estimating IJMA in Appendix). During the period from October 2007 to March 10, 2011, there were 17 earthquakes that occurred in the magnitude range between 4.7 and 7.2, for which the EEW system estimated the maximum IJMA at 5− or larger, and issued alerts to affected areas. However, the distributions of estimated IJMA 5− or larger associated with these events were limited only to very local areas. Among the 17 events, there were only 10 events that recorded IJMA 5− or larger by instruments at a few stations (The data files were downloaded from http://www.data.jma.go.jp/svd/eew/data/nc/rireki/rireki.html to compare the observed intensities with the estimated ones. This site is in Japanese only). In the 2011 Tohoku-Oki earthquake sequence, the system did not issue an alert for the Mw7.3 foreshock of March 9th, because the maximum IJMA estimated in the real-time scheme was below 5−. For the mainshock (Mw9) on March 11th, the system estimated IJMA of 5− and larger for a much broader region than the areas estimated for the previous 17 earthquakes.
Strong ground shaking was felt even in the crowded Tokyo metropolitan area (equivalent to IJMA over 5+), which is more than 300 km away from the epicenter. The number of casualties caused by the quake was not great compared to other similar size earthquakes, such as the 2004 Indian Ocean earthquake, despite the very high levels of ground acceleration (i.e., peak accelerations of over 2 g at some sites; Furumura et al. (2011)) owing to high-standard building codes and advanced engineering preparations (see Tajima et al. (2013) for a review). Here note that, since it was enacted in 1950, the Building Standard Law of Japan has been updated every time after a major earthquake has occurred. Regarding Japan’s earthquake-resistant standard, a major amendment was made in 1981 (called as “New Earthquake Resistance Standard”) while further revisions for wooden houses were made in 2000, based on damage analyses of the 1995 Mw6.8 Great Hanshin (or Kobe) earthquake.
Many other countries attributed the fewer fatalities of the Mw9 Tohoku-Oki earthquake largely to the extensive nationwide EEW system, and now plan to install dense real-time monitoring and EEW systems of their own. There have been a number of symposiums and workshops on research and developments (R&D) of EEW including an international session “Earthquake early warning developments around the world” held at the 2016 Japan Geoscience Union (JpGU) meeting jointly with the American Geophysical Union (AGU) (“the 2016 JpGU-AGU joint session on EEW” hereafter; see http://www.jpgu.org/meeting_e2016/session_list/detail/S-SS01.html) to promote communication in this endeavor among the countries. Most of the presentations at the workshops/symposiums focused on improvements of station coverage and methods of data analyses for big-net EEW systems.
However, EEW systems are useful only if the strength of structures and resilience of operations are secured at individual sites against strong shaking. We call this “site-effective preparations” for seismic safety. Figure 2 illustrates an EEW alert delivery to areas which may be struck by strong shaking. People may be able to protect themselves in seconds. Power may be turned off to shut down operations. Buildings may not collapse if they were built with a high-standard building code or retrofitted suitably. This illustration also shows that a strong quake may hit a high-tech facility and cause serious damage to the machinery if there is no seismic isolation system beneath the building. In the case of the 2011 Tohoku-Oki earthquake, preparations for seismic safety at individual sites and the operation of the extensive EEW system were most instrumental in mitigating the shaking damage. As stated above, the earthquake-resistant standard was majorly updated in 1981 and 2000. New buildings were built with the updated building standard while old buildings were retrofitted accordingly. Site-effective preparation is absolutely necessary for EEW. Without such preparations, expectations of EEW by the public would be similar to those of earthquake predictions in the past.

Schematic illustration of responses to an EEW alert including a hypothetical high-tech facility. Upon receipt of an alert, the power may be shut down. People may be able to protect themselves and buildings may not collapse if they were built or retrofitted with a high-standard building code. However, at a high-tech facility, without a seismic isolation system beneath it, a strong shaking could directly hit vulnerable machinery and cause serious damage to it. For example, machinery in operation under high-voltage and high currents may not stop operating instantaneously after the power is turned off
We (the authors of this paper) participated in the beta-phase test of the EEW system in Japan before it became publically operational in 2007, and in the beta-phase test of California Integrated Seismic Network (CISN) in the western United States since 2013 (see the real-time networks for EEW systems in Japan and the western United States in Fig. 3a, b). It has been more than a decade since public operation started in Japan while it is still in a test phase and not available to the public in the western United States. In this review, we briefly summarize how EEW systems have been developed, focusing on the developments of observation networks in Japan and the advanced abilities and limitations of EEW technologies at present. We then summarize issues pointed out during the system beta-phase testing and workshops/symposiums to address “What can we do in seconds to respond to an EEW alarm before strong shaking?” We address the knowledge gap between the advanced EEW technology and its application to improve seismic safety preparation at the sites of alert recipients, i.e., site-effective preparation. The scope of this paper is not to summarize the detailed system developments and testing, which were reviewed by other researchers (e.g., Strauss and Allen 2016; Cochran et al. 2017).

Station distribution for EEW operation: a the Japanese network stations by JMA, NIED (Hi-net and part of KiK-net), and JAMSTEC (DONET) (> 4000). Here, 30 KiK-net borehole station data around the Kanto region are included (Iwakiri et al. 2012); b the network stations by CISN, PNSN, and others that contribute to ShakeAlert in the West Coast region/USA (in beta-test phase with ~ 830 stations, as of July 2017)
Review
The desire for earthquake hazard mitigation stimulated earthquake prediction research in the past and the development of earthquake monitoring networks attempting to detect precursory phenomena. We consider it as leading to the recent development of real-time EEW systems, especially after the 1995 Kobe earthquake disaster in Japan. Now, real-time seismology and applications of EEW technology have shown remarkable advances in hazard mitigation efforts (see Kanamori et al. 1997; Kanamori 2008).
From earthquake prediction to real-time monitoring
We used to think that if an earthquake were predicted, earthquake hazards could be mitigated. Then, we asked ourselves: “How shall we respond to an earthquake prediction if it is announced minutes, hours or days in advance?” At present, it is not possible to predict an earthquake with accurate parameters (location, occurrence time, and size) before it occurs. But we have achieved the stage where we can receive an alert from an EEW system seconds before a strong quake hits a site, and explore how to mitigate earthquake damage using the information. We explore: what can we do effectively in seconds before strong ground shaking? The concept of EEW is prevalent in public now. But the public is not necessarily aware of the reality of the information service that a big-net EEW offers, and simply transferring their past expectations from earthquake prediction to big-net EEWs.
Expectations toward earthquake prediction and seismograph network installations
The history of attempting to predict earthquakes is long. In modern times, the Japanese government has started a major national project to promote earthquake prediction research, the Earthquake Prediction Plan (EPP) in 1965. EPP aimed to detect foreshocks, precursory deformation, or any phenomena associated with an impending earthquake, and installed many seismic instruments over the country. During the EPP period, there was no data recorded for precursors to lead to an earthquake prediction. But EPP continued up to its seventh term ending in 1998.
During the Japanese EPP period, there was a successful evacuation prior to a large earthquake in Haicheng, China in 1975. This Mw7.3 earthquake was preceded by precursors, i.e., many small earthquakes, a change in groundwater levels, abnormal animal behaviors, etc. (e.g., Adams 1976). The regional government determined that a large earthquake was about to occur and, the morning of February 4th, mandated the residents to evacuate to safe places. Later in the evening, the earthquake destroyed the populated city of one million residents. Most of the buildings had been built without the strength to withstand the earthquake. But the evacuated people were saved. The evacuation resulted in mitigating the loss of human lives (casualties of ~ 2000). At the time, this episode was considered a successful prediction, inspired optimism for earthquake prediction, and stimulated the start of large earthquake prediction research projects around the world. Many new networks of seismic instruments were installed to acquire high-quality data.
In the following year, 1976, an Mw7.6 earthquake struck the city of Tangshan, which had one million inhabitants, and is about 500 km southwest of Haicheng. There were some abnormal phenomena observed prior to the earthquake. But the authorities did not have a consensus for the impending large earthquake as no foreshocks preceded it, and did not issue an evacuation order for most of the areas. This earthquake caused over 250,000 fatalities and many injured victims, leaving the optimisms for prediction somewhat short-lived. Nonetheless, governmental funding for long-term large projects for prediction research continued in Japan, the USA, China, and other countries hoping to observe precursory seismic events or any phenomena associated with an impending earthquake. Scientists have tried to characterize earthquakes using abundant data accumulated by newly installed seismic network stations. However, there is no reliable track record of detecting precursors or associated deformation that can be used to identify an impending large earthquake such as the Mw9 Tohoku-Oki in 2011. The hypothesis in prediction research, that precursors should be detected before an earthquake, has not been verified even using a dense seismograph network. Now we know what earthquake phenomena are, and it is not easy to detect precursors for an impending destructive event from geophysical observations or characterize the entire process of future earthquake ruptures.
One of the major outcomes from the EPP research was the mapping of areas with high seismic risks based on past earthquakes. But it is a fact that most of the recent major earthquakes occurred in areas where high seismic potentials had not been assigned on the basis of probability theory, e.g., the Kobe earthquake in 1995, the Tohoku-Oki earthquake in 2011, and the Kumamoto earthquake (Mw7) in 2016 (see “Recent destructive earthquakes vs. seismic hazard risk maps” section). The first major study to predict probabilities of strong ground motion based on historical earthquakes was published by Kawasumi (1951). The probabilistic hazard map was used as a basis of the Building Standard Law in Japan. Figure 4 shows one example of seismic risk estimates in comparison with the actually measured seismic intensities: (a) comparison of predicted peak ground accelerations (PGAs) (gal) for the entire country for the coming 100 years published in late 1980s (Architectural Institute of Japan 1987) and observed PGAs (numbers in red) within 10 years of the publication; and (b) measured IJMAs for the 1995 Kobe earthquake. The PGA predicted for the area including Kobe was between 200 and 300 gal. The Mw6.8 Kobe earthquake struck a broad region in southwestern Japan, and measured PGAs of over 800 gal in and around the heavily damaged zones of Kobe City. This earthquake caused the worst catastrophe (6434 fatalities, and very large economic losses) in Japan since the 1923 Great Kanto earthquake (~ Mw8). High seismic potential had not been assigned for the area in EPP, either.

Comparison of predicted seismic risk and measured intensities: a map of peak ground acceleration (PGA) distribution (shown with contours of gal) estimated for 100 years over the country published by Architectural Institute of Japan (1987). The original map was derived based on the historical seismic activity by Kawasumi (1951), and was reflected in the modified Building Standard Law in 1981. Actually measured PGAs (in red) that exceeded 600 gal at JMA and NIED strong motion stations in the 1990s including the 1995 Kobe earthquake are indicated; b measured intensities for the 1995 Kobe earthquake. PGAs of over 800 gal were recorded by two instruments in Kobe and assigned intensities (IJMA) were 6, whereas the predicted PGA for this area was 200–300 gal as is shown in (a). Note that at the time, the IJMA scale was described with seven levels from 0 to 6, and was modified to 10 levels (0, 1, 2, 3, 4, 5−, 5+, 6−, 6+, 7) based on the instrumental data in 1996 (see Midorikawa et al. 1999)
Following the Kobe earthquake, Japan has developed the world’s most extensive real-time earthquake monitoring network, installing many observation arrays of borehole seismic stations and dense strong-motion instruments (Okada et al. 2004) as well as extensive GPS arrays (e.g., Sagiya 2004). The dense real-time seismic network enabled the country to start the nationwide EEW system that has been operational in public under JMA since 2007 (Hoshiba et al. 2008). Independent of the nationwide EEW system, on-site real-time monitoring systems have been developed individually and dedicated for specific facilities in railway operations (e.g., Japan Railways) and industries in private sectors (semiconductor factories, chemical plants, etc.).
On-site real-time monitoring for front alarming
There have been ideas to forecast strong ground shaking at a site from an earthquake that occurs at a distance. The system would rely on signals from an earthquake detected at a nearby site, and transmit an alarm to affected areas at a further distance before strong ground shaking arrives. This kind of idea for front alarming already existed in the nineteenth century, and was presented by J. D. Cooper in San Francisco in 1868. However, the idea could not be implemented due to technical limitations at that time (Nakamura and Tucker 1988). Late in the twentieth century, dedicated on-site real-time monitoring systems were developed for specific facilities to detect an event and take necessary actions before strong shaking arrives. Research and development into how to forecast strong ground shaking at a given site has been carried out, independent of the big network installation and prediction research in Japan.
The most notable front alarm system was developed systematically by the Japanese National Railways (JNR 1949–1987, now Japan Railways Group) to secure safe railway operation, i.e., protect from earthquakes trains running at high speeds. Nakamura (1996) reviewed the R&D history of the real-time earthquake monitoring and front alarm system that led to the creation of the Urgent Earthquake Detection and Alarm System (UrEDAS). This system became fully operational in the 1980s, and was put to practical use for Shinkansen (bullet train) operation after an experimental period. Nakamura (1996) examined the railway damage on a magnitude (M) vs. epicentral distance (Δ) diagram (see Fig. 5; after Nakamura (1996)) that shows railway damage may occur for earthquakes with M ≥ 5.5, in the areas of epicentral distance up to ~ 5 km for M~ 5.5, and over 100 km for M > 7.5. Some follow-up surveys of railway damages using more recent earthquakes also indicate a similar trend, a certain correlation between M and Δ (e.g., Ashiya et al. 2007). If the on-site monitoring system estimates the magnitude and epicentral location rapidly using the beginning part of seismic signals, it can issue an alarm to trains running in the affected areas to slow down and stop. The basic idea of this alarm system is to exploit the difference of P- and S-waves’ propagation speeds, i.e., ~ 6 to 7 km/s for P-wave and less than 4 km/s for S-wave near the ground surface. S-waves convey three to ten times stronger motions than P-waves, but propagate more slowly than P-waves.
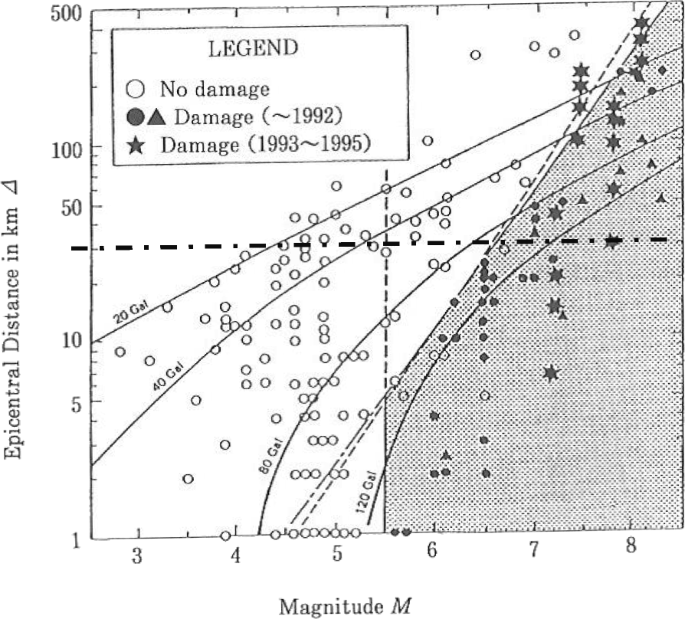
Railway damage evaluated on a magnitude (M)-epicentral distance (Δ km) diagram. This is a copy of Fig. 2 in Nakamura (1996) with slight modification (courtesy by Y. Nakamura). The dashed horizontal line indicates the epicentral distance of 30 km. For M > 6.5, damage occurred at sites of Δ > 30 km. For ~ 5.5 < M < 6.5, there was damage at some sites with Δ < 30 km
UrEDAS calculates continuously at the instrument site parameters from real-time waveform data, such as back azimuths, the ratios of vertical to horizontal amplitudes to discriminate between P- and S-waves, and predominant frequency to estimate an earthquake’s magnitude. Once it detects an earthquake, preliminary earthquake parameters (i.e., magnitude, epicentral and hypocentral distance, etc.) are estimated quickly at the site. Then, it evaluates the parameters on the M – Δ diagram (similar to that in Fig. 5) and may issue an alarm if necessary. The process time was ~ 3 s in 1995. They continued improving the speed of accurate parameter determination and developed a new generation of UrEDAS, called compact UrEDAS, that could issue an alarm in 1 s (e.g., Nakamura 2004).
When the 2004 Niigata Chuetsu earthquake (Mw6.6, depth ~ 13 km) occurred, there were four trains running above the epicentral area. Four compact UrEDAS stations in the area detected the earthquake signals and issued an alarm in 1 s. Trains Toki 325 and Toki 332 received the alert 3.6 s after the earthquake origin time (to), Toki 406 in 4.5 s, and Toki 361 in 11.2 s after to. Immediately after they received the alert, these trains were slowed down automatically to stop. One of the trains (Toki 325), which slowed down but did not stopped completely, was derailed but without causing any injuries. This was the first occasion anywhere in the world that a dedicated real-time monitoring system prevented an earthquake disaster for running trains (Nakamura 2008).
Japanese industries in general reinforced factories and installed on-site real-time earthquake monitoring systems, especially after the 1995 Kobe earthquake. Takamatsu (2016) reported how semiconductor industries improved safety preparations against earthquakes. His company developed a combined use of alerts from the big-net EEW by JMA with their own on-site monitoring system; these supplement the deficiencies of each other to function effectively.
Big-net EEW systems
EEW system in Japan
After the 1995 Kobe earthquake, the National Research Institute for Earth Science and Disaster Resilience (NIED) led the installation of dense real-time seismograph networks in Japan. K-NET (Kyoshin network) is a network of strong-motion seismographs installed at more than 1000 observation stations on the ground surface that are distributed every 20 km uniformly over the country. It has been operated by NIED since June 1996. KiK-net (Kiban Kyoshin network) is a network of strong-motion seismographs deployed at approximately 700 stations nationwide, each of which consists of 2 sets of seismographs, 1 set installed in a borehole co-located with a set of Hi-net (high sensitivity seismograph network) instruments, and the other set on the ground surface. The strong-motion data recorded by K-NET and KiK-net are immediately transmitted to the data management center of NIED in Tsukuba and are made available to the public via a web site (Okada et al. 2004).
On the other hand, JMA and the Railway Technical Research Institute developed a system called Nowcast Earthquake Information System (Hoshiba et al. 2008) while NIED developed a real-time earthquake information system (REIS) (Horiuchi et al. 2005; Nakamura et al. 2009). Following these system and algorithm developments for real-time data analyses in October 2007, JMA started nationwide public operation of an EEW system by combining the products from REIS and Nowcast (Nakamura et al. 2009).
The Japanese EEW system that consists of over 4000 real-time monitoring stations (Fig. 3a) can issue an alert to affected areas seconds before a strong hit if the areas are outside of the gray zone. The hypocenters and magnitudes are determined by a combination of several techniques using data from the JMA network, NIED’s Hi-net, and 30 KiK-net borehole stations in the Kanto region (Iwakiri et al. 2012). The system has been locating 10 to 20 events per day including a few felt earthquakes in and around Japan, and issues alerts when strong ground shaking (IJMA ≥ 5−) is expected. The system updates the earthquake parameters with more accurate information every second. This is a new application of real-time seismology for earthquake hazard mitigation. Since October 2013, NIED has been providing a real-time view of ground motions (PGA or PGV) recorded at K-NET and KiK-net stations over the country that are updated every second, overlaying the EEW monitoring screen (Kyoshin Monitor: http://realtime-earthquake-monitor.bosai.go.jp/).
In 2011, the extensive real-time monitoring and EEW system was operating across the country (e.g., Hoshiba and Iwakiri 2011; Hoshiba et al. 2011). The operations of the system along with individual on-site monitoring systems and engineering preparations have been tested effectively for advantages and shortcomings during the Mw9 earthquake. This earthquake on March 11th was preceded by an Mw7.3 foreshock on March 9th, and then ruptured the source areas of several previous large earthquakes (M > 7) in one sequence (Tajima and Kennett 2012; see the review by Tajima et al. 2013). The March 9th foreshock (Mw7.3) was first considered as “a typical large earthquake in the area” and a spokesman from JMA urged the general public to take precautions against its large aftershocks. It turned out that the March 9th event was a mere foreshock of the Mw9 main event that was the 4th largest event recorded instrumentally since 1900, and one of the seven deadliest events with more than 10,000 casualties in the twenty-first century.
It was a rare experiment of the nationwide EEW system to detect and estimate the magnitude of a large earthquake that has evolved to a great Mw9 while also issuing alerts with updated information, so the public can take response actions in a very limited time frame. The EEW system detected the event 22 s after the origin time and issued an estimated JMA magnitude (Mj) as 7.2 in 8.6 s after the event detection and continued updating the magnitude estimate up to Mj8.1 in 105 s. Mj8.1 was the final magnitude determined by the real-time system. Numerous research papers have been published, which study the Mw9 source characteristics that ruptured several previous source areas of an M7-class earthquake in one sequence of ~ 150 s duration taking a complex rupture process. The shortcomings of the EEW system identified in the parameter determination of the long-lasting complex source rupture process have been improved with inclusion of long-wavelength data (e.g., crustal deformation by GPS) to rapidly estimate the final size of a large earthquake in the real-time scheme (e.g., Ozaki 2011; Ohta et al. 2012; see reviews by Tajima et al. 2013). Lay (2017) provided a thorough review of published papers to date that detailed the complex source characteristics, revising the magnitude to Mw9.1. But only the gross picture of the rupture characteristics obtained from preliminary studies reviewed by Tajima et al. (2013) is necessary to review EEW application and practice.
As discussed in Fig. 1, the warning time is critical. Figure 6 illustrates the warning times (shown on concentric circles from the epicenter) and the distribution of measured intensities for the Tohoku-Oki earthquake. At location A1, IJMA6− shaking arrived in 6 s after the initial earthquake alert. Likewise, strong shaking of IJMA7 arrived at A2 and IJMA6+ at A3 in 19 s, IJMA6+ at A4 in 35 s, and IJMA6+ at A5 in 49 s, respectively. Location A6 is in Chiyoda-Ku/Tokyo where shaking of IJMA5+ arrived in 67 s after the first alert issuance (see http://www.data.jma.go.jp/svd/eew/data/nc/rireki/201103.pdf#page=4).

Warning time and intensity distribution for the 2011 Tohoku-Oki earthquake. Here, the warning time is the time interval between the alert issuance and ground shaking arrivals estimated on concentric circles. This figure was copied from “Report of earthquake early warning alerts” (in Japanese) at: http://www.data.jma.go.jp/svd/eew/data/nc/rireki/201103.pdf#page=4, and slightly modified with location labels of A1 to A6, and other labels into English. The scale of IJMA 4 to 7 is color coded below the map. At location A1 IJMA6−, shaking arrived 6 s after the initial alert was issued. Likewise, strong shaking of IJMA7 at A2 and IJMA6+ at A3 in 19 s, IJMA6+ at A4 in 35 s, and IJMA6+ at A5 in 49 s, respectively. Location A6 is in Chiyoda-Ku/Tokyo where shaking of IJMA5+ arrived in 67 s after the initial alert
Many on-site dedicated systems operated at individual facilities also detected the event and alarmed the facilities to take necessary actions including stopping trains, etc. JMA issued warnings for large tsunamis 3 min after the earthquake origin time (Ozaki 2011), which should have provided sufficient time for most people to escape. However, complications in the information transfer, and emergency response, partly due to the underestimated tsunami heights in the beginning, caused problems of miscommunication so that many people were killed by the huge onrush of water. Tsunamis completely destroyed many coastal cities and towns along the Pacific coast of northeast Japan, causing a large number of casualties and the much-publicized failure of a nuclear power plant in Fukushima. The estimated damage was over US$300 billion. Nonetheless, without the big-net EEW and on-site monitoring systems and intensive engineering preparations, the loss of lives and damage of facilities could have been far worse (see Tajima et al. 2013). The casualties of this earthquake (Mw9) were less than those caused by other smaller but destructive earthquakes in the Mw range of 6.6 to 7.9 (see Table 1). The relatively few casualties from the Mw9 earthquake are a testament to Japan’s emergency systems that include not only the big-net and on-site EEW systems but also the rigorous building codes and advanced engineering technologies for quake resistance (National Institute for Land and Infrastructure Management, and Building Research Institute 2012).
EEW system developments in other countries
Other countries including Mexico, the USA, Turkey, Taiwan, Korea, China, and countries in Europe have been also installing real-time network stations and developing EEW systems, for which there is an excellent review of progresses focusing on big-net EEWs around the world (Allen et al. 2009). Among the networks, the EEW system developed in Mexico by the Mexican Seismic Alert System (Spanish: Sistema de Alerta Sísmica Mexicano or SASMEX) is the first public EEW system in the world. This system was installed after the catastrophic 1985 earthquake (Mw8) and has been operational since 1993 (Espinosa-Aranda et al. 1995). At present, the network has about 100 seismic sensors with 28 more stations in development.
During the preparation of this article, there were two large earthquakes in Mexico, one (Mw8.2) occurred in the Gulf of Tehuantepec off the coast near Chiapas on September 7 and the other one with Mw7.1 in central Mexico on September 19 in 2017. The September 19 earthquake struck the greater Mexico City area. More than 200 buildings collapsed, 370 were killed, and ~ 6000 people injured. This earthquake coincided with the 32nd anniversary of the 1985 Mexico City earthquake (Mw8) that killed many thousands of people (in the range from ~ 5000 to 40,000), injured ~ 30,000 people, and destroyed many buildings including 412 that collapsed. When the September 19, 2017 earthquake occurred on land, ~ 120 km from Mexico City, people in the city felt ground shaking from P-waves a few seconds before they heard the alarm siren. Many people began evacuating buildings before the alarm sounded, according to surveillance camera records. The S-wave arrived in many locations in Mexico City about 6 s after the beginning of alarm siren and the shaking increased in amplitudes reaching a maximum after 17 s. Some buildings in the city collapsed completely within seconds of the beginning of the alarm siren (Nakamura 2017).
This event provided important reminders about EEW systems. EEW cannot prevent buildings from collapsing; but damage can be reduced or avoided if better building choices are made. If the seismic monitoring network coverage in the epicentral area were denser and the data processing were faster, there could have been a longer warning time in Mexico City (i.e., more than 20 s), instead of 6 s. If the buildings that collapsed had been reinforced to be earthquake resistant, they might have performed better during the September 19, 2017 quake. A high-standard building code and reinforcement for earthquake resilience must accompany an EEW system environment, as is widely adopted in Japan. No modern multi-story buildings have collapsed immediately during the shaking of any of the recent strong earthquakes in Japan.
In the western United States, the background seismicity is moderate. But the region does have high hazard, with destructive earthquakes (Mw ≥ ~ 6.7) likely along active faults. The 1989 Loma Prieta (Mw6.9) and the 1994 Northridge (Mw6.7) caused serious damage in urban areas in northern and southern California, respectively. The Loma Prieta event ruptured a small portion of the zone along the southern section of the fault previously ruptured by the 1906 San Francisco earthquake (Mw7.9, with the estimated maximum Modified Mercalli Intensity (MMI) of IX (Extreme) in San Francisco and several other cities, casualties of ~ 3000, over 80% of the City of San Francisco was destroyed). Thus, a large event (Mw > 6.7) is still likely to occur in the region. The Northridge earthquake occurred on a blind thrust fault near the epicenter of the 1971 San Fernando earthquake (Mw6.6, maximum MMI of IX) and directly hit Los Angeles, a populated US city, for the first time since the 1933 Long Beach earthquake (Mw6.4).
At the urging of scientific groups and organizations, the Federal and state governments funded the installation of an improved real-time monitoring network and the development of an EEW system, ShakeAlert. It now covers a broad range along the West Coast of the United States (Given et al. 2014; Strauss and Allen 2016; Cochran et al. 2017), but the station distribution is not homogeneous as shown in Fig. 3b. In the populated areas with high seismic risk, i.e., the greater Los Angeles, San Francisco Bay, and Seattle areas, the station spacing is about 10 km. The installation goal for other areas with low population but high hazard risk is 20 km between stations. Regions where there is no known seismic hazard and low population, the station spacing goal is 40 km (Peggy Hellweg, personal communication).
An EEW system in a big-net environment promises results similar to those in Japan, western United States, and other regions/countries, i.e., alerts will be delivered seconds before strong shaking starts. To achieve the goal, they target achieving similar station coverage to Japan’s modern system of networks, as well as data analysis speed and accuracy. It is important that recipients/end-users of EEW alerts in other countries realize that seismic safety preparations at individual (recipients) sites are very advanced in Japan, likely more advanced than in many other countries. This is in addition to its earthquake-resistant building code. In Japan, private sector industries build resilient structures that damp or are isolated from strong ground shaking, in addition to using on-site seismic monitoring and calibration using data from background seismic activity. Excessive emphasis on station coverage density and rapid real-time data analysis may distract from the key issues of seismic safety preparations which must be the foundation on which EEW relies.
The review by Allen et al. (2009) lists concerns about algorithms for detecting seismic signals, uncertainties in the conventional ground motion prediction equations (GMPE), speed of analysis and accuracy in location, and magnitude determinations. In fact, estimates of ground motion intensities by a big-net EEW system as a function of distance using GMPE are not always in agreement with observed intensities. Actual intensity distributions in felt earthquakes show short-wavelength variation. The frequency band in which seismic intensities are determined is from ~ 0.5 to 10 Hz, and thus there are significant effects from the response of local subsurface structure. Here, note that the incident azimuth of the incoming wave (propagation direction) and a site amplification factor also affect the ground motion on the surface at a site, resulting in its deviation from estimates based on a conventional GMPE (Hayashida and Tajima 2007). The variability can be substantial depending on earthquake locations (hypocenters). Because of the spatial resolution associated with station spacing (~ 20 km) and the required speed for alarming, it may not be practical or meaningful for big-net EEWs to model all possible variability.
Figure 2 illustrates an example of hypothetical scenarios during an earthquake at a high-tech facility. The facility contains expensive machinery that runs under high voltage and high currents to produce a strong magnetic field, and is vulnerable to strong shaking when it is in operation. In the event of a strong quake, the facility may receive an EEW alert. Automatically, the power will be shut down. The building will not collapse assuming it was built with a high-standard building code. But the expensive machinery may not stop operating instantaneously. If the machine in operation is hit by a strong quake directly, it will be damaged severely. It must be protected with a system to isolate or damp strong ground shaking beneath the building. In any case, an isolation (or damping) system should work effectively, regardless of an earthquake location since the warning time may be very short before shaking from a strong quake begins. Without such a system, the economic loss in terms of expensive machinery will be large. In reality, it is not a common practice to install (include) a damping or isolation system beneath the facility in southern California, where background seismicity is moderate. It is considered to be expensive. This situation evokes concerns not only about EEW alerts provided by a big network and on-site monitoring systems but also collaborations with seismic engineers during the construction phase. An incremental improvement in the speed of determining accurate earthquake parameters will not make a difference in the actions needed to effectively mitigate the hazard at the site.
Recent destructive earthquakes vs. seismic hazard risk maps
As stated in subsection “From Earthquake prediction to real-time monitoring,” one of the major outcomes from the EPP research in Japan was to map the areas with high seismic risks based on the past large earthquakes. But it is a fact that most of the recent destructive earthquakes occurred in the areas where the assigned seismic potential was not particularly high relative to other areas, since the history of instrumental seismic observation was not long (~ 100 years at the time), and the information from ancient documents which described earthquake damage was found mostly in populated cities, and not homogeneous. Besides, the published hazard risk maps were prepared for experts using probabilistic methods for risk estimates and are not easy to understand what these values mean. Figure 7 is an example of probabilistic seismic hazard map for ground motion for the entire country that shows the probabilities predicted for ground motion of IJMA ≥ 6− and IJMA ≥ 6+ for the next 30 years (published in 2010). The probabilities for IJMA ≥ 6− assigned for the regions of strong ground shaking by the 2011 Tohoku-Oki and 2016 Kumamoto earthquakes were low, mostly under 6%, although it is not clear what the difference between the probability values actually means from a practical viewpoint.

Probabilistic hazard map of ground motion for 30 years published in 2010. The original figures were downloaded from the website of the Headquarters for Earthquake Research Promotion: (https://www.jishin.go.jp/evaluation/seismic_hazard_map/shm_report/shm_report_2010/. https://www.jishin.go.jp/main/chousa/10_yosokuchizu/ka_bunpu.pdf). This site is in Japanese only; a corresponding site in English is https://www.jishin.go.jp/main/index-e.html that shows only the 2007 version and is not updated. There are areas along the Pacific coasts from Kanto to Shikoku and northeastern Hokkaido where ground shaking of IJMA6− or greater was predicted to occur in the coming 30 years with a probability of more than 6% (left). Probabilities of 6% or higher for ground shaking of IJMA6+ or greater were predicted only for narrow zones along the Itoigawa-Shizuoka Tectonic Line and the coast in Tonankai region, and for other small areas (right). Note that these hazard maps show low probabilities of less than 6% to most of the regions which were struck by strong ground shaking of IJMA6− and greater during the 2011 Tohoku-Oki and the 2016 Kumamoto earthquakes
Figure 8 shows the measured IJMA’s for the Mw9 Tohoku-Oki earthquake in 2011. The Tohoku region and part of the Kanto along the Pacific coast broadly suffered strong ground shaking of IJMA ≥ 6− during the Mw9 earthquake. Figure 9 shows the IJMA distribution measured for the April 16, 2016 Kumamoto earthquake (Mw7.0). The instrument stations that measured intensities 6− and larger surround the epicenter (denoted with +) (top). The area of strong shaking around the epicenter is enlarged (lower left), and the estimated intensity distribution is shown by contours (lower right). The recorded IJMA’s for the 2011 Tohoku-Oki and 2016 Kumamoto earthquakes far exceeded the predicted IJMA’s in 2010.

Observed intensity distribution for the 2011 Tohoku-Oki (Mw9). Intensities from 3 to 7 (IJMA) measured by instruments are shown at seismic stations (left) and the estimated distribution of intensities by contours (right) (the figures were downloaded from: http://www.data.jma.go.jp/svd/eqev/data/2011_03_11_tohoku/index.html). The intensity scale is color coded from 1 (white) to 7 (pink), and the red star shows the epicenter. The region with IJMA6− and greater has a stretch of over a few hundred kilometers along the Pacific coast

Intensity (IJMA) distribution measured for the April 16, 2016 Kumamoto earthquake (Mw7.0). The instrument stations that measured intensities 6− and larger are located in the area surrounding the epicenter (+) (top). This area around the epicenter is enlarged (lower left), and the estimated intensity distribution is shown by contours (lower right)
Feedback from big-net beta-phase tests
We participated in the beta-phase test of the nationwide EEW system in Hiroshima, western Japan from 2003 to 2007. During the period, we experienced a few felt earthquakes, but not any destructive events in the area. The events were located more than 100 km away since the local seismic activity in that region is not so high as in other parts of Japan. We received an alert more than 20 s before we felt ground shaking, i.e., the warning time (the time interval between an alert and ground shaking arrival) was more than 20 s. We watched the expanding concentric circles for P- and S-wave propagation fronts from the epicenter on the monitor screen and confirmed that the system forecast the arrival time of S-waves well coinciding with weak felt motion. On the other hand, we learned that the actual ground motion intensities deviated from the intensities estimated using GMPEs on the smooth concentric circles. The complex subsurface structure should affect the ground motions on the surface, which are characterized by short-wavelength variation. The observed intensity variability depends on the incident azimuths and amplification factors from the borehole to the surface, and can be substantial (Hayashida and Tajima 2007).
In western United States, the beta-phase test of ShakeAlert started in 2013 (Given et al. 2014). During the period (as of September 2017), two moderate earthquakes (Mw 5.1 and 6) occurred in the network coverage. The Mw5.1 La Habra earthquake on March 28, 2014 caused moderate property damage around the epicentral area locally but no injuries. Recipients at a site of ~ 32 km from the epicenter received an EEW alert, and then in a couple of seconds felt weak motion. The warning time was a couple of seconds. The other earthquake of Mw6 occurred in South Napa near the San Francisco Bay area on August 24, 2014. The ShakeAlert team has been collaborating with the Bay Area Rapid Transit (BART), a local railway network, to help develop a system for safe train operation in the occurrence of earthquakes (Strauss and Allen 2016; Hellweg et al. 2016). They report that when the South Napa earthquake occurred, the earthquake alert was delivered successfully to the central system of BART operation 5 s after the earthquake origin time and 8 s before S-wave arrival to the center.
Here note that at the earthquake origin time (3:20 am), no trains were in operation, and the report of the EEW test with BART response is somewhat misleading for general public in terms of effective alert delivery. If trains were in operation near the epicenter, the time frame of 5 s for issuing an alert may not be sufficient for the centralized system to take action for train safety. In 5 s after the earthquake occurrence, the P-wave front propagates about 30 km and S-wave about 18 km from the epicenter. The big-net EEW system may not issue an alert before strong shaking to affected areas in the gray zone for this earthquake while an Mw6-class earthquake can cause railway damage in areas up to ~ 30 km from the epicenter (refer to Fig. 5). The BART central system is located ~ 45 km away from the epicenter since the S-wave arrival was 13 s after the origin time, and thus received the alert 8 s before S-wave arrival (see the timeline in Fig. 1).
In the past half-century, three Mw6-class earthquakes caused serious damage in urban areas in California including casualties. The 1971 San Fernando (Mw6.6) recorded a maximum MMI of IX (violent) and caused casualties of 65, ~ 2000 injured, and over $500 million economy losses. The 1989 Loma Prieta (Mw6.9) also recorded a maximum MMI of IX, and caused 63 fatalities, ~ 4000 injured, and ~ $6 billion losses. The 1994 Northridge earthquake (Mw6.7) occurred at a hidden fault in close proximity to the 1971 San Fernando earthquake along the southern edge of the western Transverse Range in southern California. The San Fernando aftershocks form a plane extending from a depth of 15 km to the surface, dipping toward the northeast at about 40°. The Northridge aftershocks delineate a fault extending from a depth of 18 km to about 5 km, dipping toward the southwest at about 40°. The fault planes of the two comparable earthquakes dip in opposite directions and represent conjugate faulting in a compressive stress regime (Hauksson et al. 1995; Mori et al. 1995). The Northridge earthquake measured the peak acceleration of 1.8 g (16.7 m/s2) at a strong-motion station about 7 km south of the epicenter. It was the highest ground motion ever recorded instrumentally in an urban area in North America, causing damage in the local area around Los Angeles (with the death toll of 57, more than 8700 injured, and the estimated property damage of ~ $30 billion or more). The damage caused by these earthquakes concentrated in the areas around the epicenters (within the gray zone, e.g., with an epicentral distance of less than 30 km).
In the beta-phase tests of big-net EEW systems, both in Japan and the western United States, we have not experienced any destructive earthquakes. But we learned important lessons regarding the limited time frame of alert delivery from a big-net EEW system and necessities for site-effective safety preparations. In the 2016 JpGU-AGU joint session on EEW, there were reports of big-net teams, i.e., from JMA in Japan, CISN in USA, Central Weather Bureau of Taiwan (CWBT), and Centro de Instrumentación y Registro Sísmico A.C. (CIRES) in Mexico (see http://www2.jpgu.org/meeting/2016/PDF2016/S-SS01_all_e.pdf). They focused on the improvements of computation algorithms for speeding-up accurate parameter determinations in real-time, or planning to increase the density of network station coverage. Big-net teams also suggest that end-users (recipients) develop systems to make use of EEW alerts, which are to be delivered from a big-net system.
Here, we would like to reiterate that end-users can receive an alert from a big-net EEW system before a strong hit if their locations are outside the gray zone. If they are closer to the epicenter, they may not receive an alert before strong shaking while stronger ground shaking may hit the sites causing more serious damage (Fig. 1). Remember the successful use of UrEDAS system in the 2004 Niigata Chuetsu earthquake described in subsection “On-site real-time monitoring for front alarming,” i.e., the on-site system detected an earthquake (Mw6.6, depth ~ 13 km), issued an alert within a few seconds from the earthquake origin time to nearby trains which were running at high speeds, and slowed and stopped the trains. The system successfully prevented a disaster for the trains (Nakamura 2008).
The feedback from the beta-phase tests highlights key issues to be addressed for earthquake safety preparations using alerts from big-net EEW systems.
Variation of ground motions and site-specific factors
A big-net EEW system estimates seismic intensities in the affected areas using a conventional GMPE, once the earthquake parameters (hypocenter and magnitude) are determined. Here, a GMPE relies on probabilistic distributions of observed ground motion parameters (i.e., peak ground acceleration, peak ground velocity, seismic intensity) for a given earthquake magnitude, source-to-site distance, etc. The station spacing is roughly the measure of optimum resolution and calculation speed of a big-net system, and may be larger than 20 km if the network is during a development stage. Nonetheless, the ground motion variation in a critical frequency band of ~ 0.5 to 2 Hz is in a much smaller scale than a typical big-net station interval, i.e., ~ 10 to 20 km. In fact, observed intensities of ground motions are not necessarily in agreement with the estimates by a big-net EEW. Recently, researchers proposed a new method of “PLUM” (Propagation of Local Undamped Motion) for the JMA EEW system to better predict seismic intensities directly from the observed real-time intensities near target sites (Kodera et al. 2018).
We did some exploratory studies to visualize the variability of ground motions using data from a dense local strong motion network in Yokohama City (Yokohama City strong motion network, YCSMN). We also have some results from KiK-net data analyses to illustrate the local subsurface effects among the stations, and event location dependency for ground motion variability.
Short-wavelength variation of ground motions
There is a dense network of strong-motion instruments that has been operating within a small area (~ 20 × 30 km2) in Yokohama City since 1999. The total number of stations was 150 at the peak with its average station interval of ~ 1.5 km or less, whereas it is reduced to 42 now. The data from this network show substantial variation of ground motions. Figure 10 compares the estimated JMA seismic intensities based on the JMA EEW scheme (left) with calculated ones using data from YCSMN (right) for two earthquakes. Note that the JMA EEW system computes IJMA using the GMPE with closest distances from the estimated earthquake fault but does not include information regarding site-specific conditions (see the method for estimating IJMA in the JMA EEW system in Appendix). The estimated intensities in the figure are the results of ex-post evaluations. The site amplification coefficients were obtained from averaged values of S-wave velocity in the upper 30 m (AVS30) at each grid point (at 250 m interval) in and around Yokohama City, provided by the Japan Seismic Hazard Information Station (J-SHIS, by NIED).

Comparison between JMA seismic intensities estimated in the real-time EEW scheme of JMA (left) and calculated intensities using data from YCSMN stations (right). The procedure of intensity estimation is explained in Appendix. Here, we used the site amplification map of the Japan Seismic Hazard Information Station (J-SHIS by NIED) to obtain site amplification coefficient at each grid (250 m interval) for the JMA estimates. The JMA intensity scale (IJMA) is shown at nine levels from 1 (white) to 7 (purple): a EQ1: July 23, 2005 NW Chiba Pref. (Mw5.9, depth 73 km; see Table 3 in Appendix). The IJMAs estimated in the EEW scheme are 4 (green) in the whole area, regardless of different site conditions. The actual IJMAs calculated with data from the YCSMN (142 stations) vary from 5− (yellow) on the northeast side to 3 (light blue) on the southwest and northwest sides. b EQ2: March 11, 2011 off the Pacific Coast of Tohoku (Tohoku-Oki; Mw9, depth 24 km). The IJMAs estimated for Mj8.1 using the real-time EEW algorithm in 105 s after P-wave detection were 4 (green) in the basin and 3 (light blue) on the hillside. The actual IJMAs calculated at the YCSN stations (118 stations) range from 4 (green) to 5+ (orange)
Figure 10a shows the estimated and observed seismic intensities for a local earthquake (Mw5.9, Mj6, depth 73 km) in NW Chiba Prefecture on July 23, 2005 (see the event parameters in Table 3 in Appendix). The intensities estimated by the JMA processing are 4 in the entire area, regardless of different site conditions. The actual intensities calculated using data from the YCSMN stations are from 3 on the southwest and northwest sides, to 5− on the northeast side showing short-wavelength variation, as short as the station interval of ~ 1.5 km or less. Figure 10b compares the estimated and measured intensities for the 2011 Tohoku-Oki earthquake (Mw9, depth 24 km). In the beginning, i.e., in 8.6 s after the P-wave detection preliminarily determined Mj was 7.2, and the estimated intensities were 3 on the hillside and 4 in the deep sedimentary basin. Mj was updated repeatedly up to 8.1 (final value in EEW) in 105 s after the P-wave detection. Even for Mj8.1, the estimated intensities were roughly 4 all over the city. However, the actual intensities calculated using data at YCSMN stations range from 4 on the hillside to 5+ at some stations in the basin area. Here, note that the JMA EEW system computed seismic intensities using the GMPE of Si and Midorikawa (1999) with “the simplified closest distances” from the estimated earthquake fault, which is assumed a circular fault (see “Estimation of seismic intensity in the JMA EEW system” in Appendix). In the case of a large earthquake, the source duration becomes long and the rupture process becomes complex, making it difficult to estimate the final magnitude and fault size in a real-time processing. For the 2011 Tohoku-Oki earthquake, more than four source areas on the fault contributed to strong-motion generation (e.g., Kurahashi and Irikura 2011; Asano and Iwata 2012). The JMA system repeatedly updated source information (hypocenter and depth), and we used the final estimation of hypocenter location (15.9 s after the detection) and magnitude (116.8 s after the detection), to derive the distance. The intensity estimation based only on the GMPE is not necessarily adequate for such a complex long-lasting rupture characteristic.
Using other local event data, we tested the effects of incident azimuths and angles of incoming waves on the ground motion variation that also depend on the propagation distance. Figure 11 shows an example. We used three shallow earthquakes of a similar magnitude (Mw ~ 4.8 to 5.2), which are located at distances of 60~70 km from the network (see the event parameters in Table 3 in Appendix). The map shows the event locations relative to YCSMN. The incident azimuths of seismic waves are roughly from (a) south; (b) east; (c) west. For these events, there is no noticeable difference among the intensities estimated with the JMA algorithm since the magnitudes and epicentral distances are similar to each other. However, the observed ground motions at YCSMN stations show short-wavelength variation in the intensity range from 2 to 4 and different patterns among the events, reflecting 3D structural effects along the propagation paths. Our examination of YCSMN data suggests the scale of ground motion variation and the limitation of spatial resolution provided by a big network.

Variation of IJMAs calculated at YCSMN stations for three shallow local events (hypocentral distance R ~ 60 to 70 km) with a moment magnitude (Mw) from 4.8 to 5.2 (see the list of earthquakes in Table 3 in Appendix). The incident azimuths of seismic waves are roughly from a south for EQ3; b east for EQ4; c west for EQ5. Note the variation of intensities observed at stations in YCSMN among the events even though the epicentral distances and the magnitudes are similar to each other
KiK-net data analysis
More than a decade ago, we investigated the subsurface amplification using data recorded in the borehole and on the ground surface at KiK-net stations in Hiroshima Prefecture (Hayashida and Tajima 2007). Here, we selected Hiroshima Prefecture as the study area since the depth to the bedrock (where Vs > 2500 m/s) is shallow (less than several hundred meters) and the KiK-net borehole sensors are located on hard rocks. Thus, it is suitable to test the local amplification of seismic waves from the bedrock to ground surface using data recorded at relatively stable stations in Hiroshima. In this section, we follow up the study by Hayashida and Tajima (2007) using some recent data.
Figure 12 shows examples of integrated accelerograms (i.e., velocity waveforms) recorded at three KiK-net stations for an earthquake of November 21, 2011 (Mw5.2, depth 12 km; Eq. 6 in Table 3 in Appendix) in Hiroshima Prefecture. The borehole sensors of these stations are located at ~ 200 m depths and S-wave velocities around the sensors are greater than 2500 m/s (see Table 2). The epicentral distances range from 45 to 69 km. There is no large difference among the peak ground velocities (PGVs) recorded at the borehole stations, but the PGVs on the surface are substantially different from each other. Especially, at station HRSH03, the ratio of the PGV on the ground surface to that in the borehole is greater than 14, while the ratios are less than 2 at station HRSH04. A large amplification at HRSH03 was observed also for other events (e.g., the 2001 Mw6.8 Geiyo earthquake; see Hayashida and Tajima 2007).

Three-component velocity seismograms recorded at three KiK-net stations (shown with solid triangles with HRSH01, HRSH03, HRSH04) in the borehole (upper three traces) and on the ground surface (lower three traces) in Hiroshima Prefecture for an event of November 21, 2011 (Mw5.2) (EQ6 in Table 3 in Appendix). Here, the waveform amplitudes are normalized by the maximum amplitude at each station, and the number above each trace is the PGV (cm/s)
Figure 13 compares the observed and estimated PGVs at the three stations for earthquakes that occurred from August 1998 to August 2017 (3.4 ≤ Mj ≤ 7.1; at epicentral distances between 24 and 200 km). The diagonal lines show one-to-one correspondence of the estimated and observed amplitudes. Here, the PGVs are estimated following the procedure in the JMA EEW scheme (see Appendix). The site amplification factors were adopted for AVS30 values from PS logging data (red square) and AVS30 map of J-SHIS (blue square) at each site (see Appendix for “AVS30”). The AVS30 values obtained from PS logging are smaller than those by J-SHIS, but the differences are not large at stations HRSH01 and HRSH03 (Table 2). At station HRSH04, there is a discrepancy in AVS30 values between PS logging and J-SHIS: the PS logging AVS30 is larger and the J-SHIS AVS30 substantially smaller than those at the other two stations. At HRSH04, the estimated PGVs derived with J-SHIS AVS30 data are larger than the observed amplitudes, and those derived with PS logging data show better fit to observed amplitudes. In general, the diagrams show that the PGVs are underestimated at station HRSH03 for most of the cases while the estimated values tend to be larger than the observations at HRSH04, especially when the site amplification coefficient is adopted from the J-SHIS map. The results from this study indicate the difficulty of accurate ground-motion estimation even at a site where the soil information is well investigated.

Comparisons between observed (vertical axes) and estimated (horizontal axes) peak ground velocities (PGVs) at three KiK-net stations (HRSH01, HRSH03, HRSH04) in Hiroshima Prefecture for earthquakes in the magnitude range from 3.4 to 7.1, from 1998 to 2017. The estimated PGVs are derived using the GMPE by Si and Midorikawa (1999) that is used in the EEW scheme of JMA. Here, the site amplification coefficients are derived using AVS30 values based on PS logging at each Kik-net station (red squares) and nationwide site amplification map, J-SHIS (blue squares), respectively (see the AVS30 values in Table 2). The diagonal indicates a one-to-one proportional line
In general, ground motion at a certain site fluctuates from the estimated value based on a GMPE due to specific effects between a source and the site that depend on rupture property on the fault, three-dimensional heterogeneity in the propagation path, and soil structure beneath the site. The diagrams in Fig. 13 do not distinguish effects among propagation distances, incident azimuths of incoming waves, and magnitudes. Possible combinations of an incident azimuth and an incident angle are almost infinite so that it is not practical to derive a formula that accounts for all these effects at each station in a big-net EEW system. There are some attempts to correct site amplification factors in real-time shake mapping (Hoshiba 2013; Hoshiba and Aoki 2015) or to derive a new GMPE to apply up to M9 mega-earthquakes (Morikawa and Fujiwara 2013). In spite of some incremental improvements in shaking estimates on the surface, we should accept the fact that the actual intensity of ground motion at a site may differ from the intensity estimated by a big-net EEW system due to the restriction of spatial resolution and rapid processing demand. After all, what end users/recipients of EEW alerts can do or should do for earthquake hazard mitigation may not change even after an incremental improvement of station coverage and the speed of accurate parameter determination in a big-net system. They should arrange their environment (residence, work place, etc.) for earthquake safety and resilience in advance.
Conclusions
Earthquake prediction has long been explored in the effort to mitigate the hazards from earthquakes. The drive to observe precursory events or deformation associated with impending large earthquakes contributed to the improvement of seismic instrumentation and the installation of many seismic networks around the world. On the other hand, ideas for a front alarming system existed already in the nineteenth century, but could not be implemented due to technical limitations. These limitations led to development of dedicated on-site real-time monitoring systems that could be installed in specific facilities late in the twentieth century. The on-site systems detect an earthquake and automatically initiated necessary actions before strong shaking arrives. Public real-time monitoring networks have evolved into EEW systems based on a concept similar to a front alarming system. Now big-net EEW systems are operational in several countries around the world.
The system of SASMEX in Mexico is the first public EEW system in the world and has been operational since 1993. Recently, deficiencies of the system itself and the lack of “site-effective preparations” were exposed in the September 19, 2017 Central Mexico earthquake (Mw7.1). The world’s most extensive nationwide EEW system has been operating in Japan since 2007, with a real-time monitoring network of over 4000 seismic stations. The advantages and shortcomings of the system, in conjunction with individual on-site monitoring systems and engineering preparations, were tested effectively during the rare Mw9 Tohoku-Oki earthquake in 2011. Many other countries attributed the lower number of fatalities from the Tohoku-Oki earthquake largely to the nationwide extensive EEW system, and now are in the process of installing or planning big-net real-time monitoring and EEW systems similar to that of Japan.
We participated in the big-net EEW beta-phase tests in Japan and the western United States. Our experience led us to have concerns about the general public’s expectations of EEW, mainly as they are not informed of what may be the limitations of the system under a certain conditions. They assume that they will receive an EEW alert before strong shaking arrives, regardless of their location relative to the epicenter, and that they will be able to take necessary actions to protect themselves such as “drop, cover, and hold on” or protect their facility.
Here, a big-net EEW system issues an alert for strong ground shaking before its arrival to areas, which are outside of the gray zone specific for the system (e.g., typically within distances of ~ 20 to 30 km from the epicenter). The system is useful for a large earthquake because strong shaking propagates through a broad region. With timely and accurate warnings before strong shaking, EEW systems can contribute to saving the lives of many people and mitigate economy losses. But if recipients were within the gray zone, they would not receive an alert before strong shaking. Ground shaking is likely to be stronger within than outside the gray zone. A moderate earthquake of Mw6-class can also cause serious damage in the gray zone. Even if they are outside of the gray zone, the warning time may be very short, with only seconds before the strong shaking starts. If a building structure does not have the strength to resist damage from strong shaking, it may collapse, killing or injuring the people inside. At a high-tech facility, even though a building is unlikely to collapse, equipment that is vulnerable to strong shaking may be severely damaged if it does not include a seismic isolation system. An isolation (or damping) system is expected to be effective, regardless of an earthquake’s location as it responds to shaking, independent of whether an alert is timely or not. Without such systems, industries are likely to experience large economic losses due to damage to expensive machinery.
In regions where seismic risk is high, but on-going seismic activity is moderate, site-effective preparation for industrial facilities and machinery vulnerable to ground shaking is not a common practice. It is considered to be expensive. This situation suggests not only about EEWs provided by a big network and on-site monitoring systems but also collaborations with seismic engineers during the construction phase. An incremental improvement in the speed of accurate parameters determinations will not make a difference in the site-effective preparation for the mitigation of seismic hazards.
It has been more than a decade since the public operation started in Japan, while in western United States, it is still undergoing testing and is not yet available to the public. At the present stage, it should be a goal of the scientists and engineers involved in EEW projects to inform the public about how big-net EEW systems work and to recommend that it be supplemented with site-effective preparations to maximize its benefits. These are critical issues to be addressed along with improvements in EEW networks and continuing developments of algorithms.
There is substantial variation of ground motions within typical station spacing of a large-scale monitoring, ~ 20 km. Simply increasing the density of station coverage in the real-time EEW system does not ensure seismic safety. The preparations necessary to improve seismic safety at specific sites will not change even if there are incremental improvements to the EEW system in big-net operations through station coverage and the algorithms. At an industrial site, combining alerts from a big-net EEW system and an on-site monitoring system may provide the most optimal ability to rapidly implement the automated responses that will most effectively reduce costly damage from earthquakes. Our conclusions are summarized as below:
-
(1)
The general public should be aware of the likely timeliness of EEW alert delivery in relationship to strong shaking. An alert is meaningful only if it is delivered sufficiently early to be able to take necessary actions before strong shaking. A big-net EEW system may provide a timely alert for a large quake (M > ~ 7) if the recipient’s site is located outside of a gray zone (e.g., ~ 20 to 30 km away from the epicenter). For example, ShakeAlert will provide timely alerts to end-users in western USA at a long-distance in the event of a great earthquake, like the 1700 Cascadia earthquake (M ~ 9). For sites located within a gray zone, end-users may not receive an alert before experiencing strong shaking. Smaller earthquakes (of a Mw6-class) can still cause serious damage in the epicentral area, which may be entirely within the gray zone, as was experienced in the recent earthquakes in California.
-
(2)
Site-effective preparations for seismic safety are important to maximize the benefits from a big-net EEW. The preparation needed is independent of incremental improvements of big-net station coverage and algorithms. EEWs are useful only if the strength and resilience of structures and operations are ensured before an earthquake happens. EEW is not a panacea—without preparations well in advance of an earthquake, the public expectation of safety through EEW will not be met and is similar to that to earthquake prediction in the past.
-
(3)
Ground motions from earthquake waves vary over distances much shorter than the typical big-net station spacing of ~ 20 km over a broad region. Variation of ground shaking should be evaluated for a shorter wavelength than a big-net station interval using a local-scale monitoring.
-
(4)
Assessment of the benefits and costs of advanced preparation for earthquakes can be critical in areas such as California/USA that have high risk of destructive earthquakes but only moderate seismic activity at present.
Abbreviations
- AGU:
-
American Geophysical Union
- BART:
-
Bay Area Rapid Transit
- CIRES:
-
Centro de Instrumentación y Registro Sísmico A.C.
- CISN:
-
California Integrated Seismic Network
- DONET:
-
Dense Ocean Floor Network System for Earthquakes and Tsunamis
- EEW:
-
Earthquake early warning
- EPP:
-
Earthquake Prediction Plan
- GMPE:
-
Ground motion prediction equations
- GPS:
-
Global positioning system
- Hi-net:
-
High sensitivity seismograph network
- JAMSTEC:
-
Japan Agency for Marine-Earth Science Technology
- JMA:
-
Japan Meteorological Agency
- JNR:
-
Japanese National Railways
- JpGU:
-
Japan Geoscience Union
- J-SHIS:
-
Japan Seismic Hazard Information Station
- KiK-net:
-
Kiban Kyoshin network
- K-NET:
-
Kyoshin network
- MMI:
-
Modified Mercalli intensity
- NIED:
-
National Research Institute for Earth Science and Disaster Resilience
- PGA:
-
Peak ground acceleration
- PGV:
-
Peak ground velocity
- PNSN:
-
Pacific Northwest Seismic Network
- R & D:
-
Research and development
- REIS:
-
Real-time earthquake information system
- UrEDAS:
-
Urgent Earthquake Detection and Alarm System
- YCSMN:
-
Yokohama City strong motion network
References
Adams RD (1976) The Haicheng, China, earthquake of 4 February 1975: the first successfully predicted major earthquake. Earthq Eng Struct Dyn 4:423–437. https://doi.org/10.1002/eqe.4290040502.
Allen RM, Gasparini P, Kamigaichi O, Böse M (2009) The status of earthquake early warning around the world: an introductory overview. Seism Res Lett 80:682–693. https://doi.org/10.1785/gssrl.80.5.682.
Architectural Institute of Japan (1987) Seismic loading—state of art and future developments. Architectural Institute of Japan, Tokyo.
Asano K, Iwata T (2012) Source model for strong ground motion generation in the frequency range 0.1-10 Hz during the 2011 Tohoku earthquake. Earth Planets Space 64:1111–1123. https://doi.org/10.5047/eps.2012.05.003.
Ashiya K, Sato S, Iwata N, Korenaga M, Nakamura H (2007) Application of earthquake early warning information to earthquake alarm systems in railway. BUTSURI-TANSA (Geophysical Exprolation) 60(5):387–397. https://doi.org/10.3124/segj.60.387 (in Japanese with English abstract).
Cabinet Office (2011) White paper on disaster management 2011. Government of Japan, Tokyo.
Cochran ES, Kohler MD, Given DD, Guiwits S, Andrews J, Meier MA, Ahmad M, Henson I, Hartog R, Smith D (2017) Earthquake early warning ShakeAlert system: testing and certification platform. Seism Res Lett 89:108–117. https://doi.org/10.1785/0220170138.
Espinosa-Aranda JM, Jimenez A, Ibarrola G, Alcantar F, Aguilar A, Inostroza M, Maldonado S (1995) Mexico City seismic alert system. Seism Res Lett 66:42–53. https://doi.org/10.1785/gssrl.66.6.42.
Furumura T, Takemura S, Noguchi S, Takemoto T, Maeda T, Iwai K, Padhy S (2011) Strong ground motions from the 2011 off-the-Pacific-coast-of-Tohoku, Japan (Mw = 9.0) earthquake obtained from a dense nationwide seismic network. Landslides 8:333–338. https://doi.org/10.1007/s10346-011-0279-3.
Given D, Cochran E, Heaton T, Hauksson E, Allen R, Hellweg M, Vidale J, Bodin P (2014) Technical implementation plan for the ShakeAlert production prototype system—an earthquake early warning system for the west coast of the United States. U.S. Geological Survey Open-File Report, pp 2014–1097. https://doi.org/10.3133/ofr20141097.
Hauksson E, Jones LM, Hutton K (1995) The 1994 Northridge earthquake sequence in California: seismological and tectonic aspects. J Geophys Res 100:12,335–12,355. https://doi.org/10.1029/95JB00865.
Hayashida T, Tajima F (2007) Calibration of amplification factors using KiK-net strong-motion records: toward site effective estimation of seismic intensities. Earth Planets Space 59:1111–1125. https://doi.org/10.1186/BF03352054.
Hellweg M, Allen RM, Strauss JA (2016) ShakeAlert: using early warnings for earthquakes in California and the US West Coast. In: Abstract SSS01–07 presented at the JpGU-AGU Joint Session. JpGU Meeting 2016, Makuhari, pp 22–26 https://confit.atlas.jp/guide/event/jpgu2016/subject/SSS01-07/advanced.
Horiuchi S, Negishi H, Abe K, Kaminuma A, Fujinawa Y (2005) An automatic processing system for broadcasting earthquake alarms. Bull Seismol Soc Am 95:708–718. https://doi.org/10.1785/0120030133.
Hoshiba M (2013) Real-time correction of frequency-dependent site amplification factors for application to earthquake early warning. Bull Seismol Soc Am 103:3179–3188. https://doi.org/10.1785/0120130060.
Hoshiba M, Aoki S (2015) Numerical shake prediction for earthquake early warning: data assimilation, real-time shake, mapping, and simulation of wave propagation. Bull Seismol Soc Am 105:1324–1338. https://doi.org/10.1785/0120140280.
Hoshiba M, Iwakiri K (2011) Initial 30 seconds of the 2011 off the Pacific coast of Tohoku earthquake (M w 9.0)—amplitude and τc for magnitude estimation for earthquake early warning. Earth Planets Space 63:553–557. https://doi.org/10.5047/eps.2011.06.015.
Hoshiba M, Iwakiri K, Hayashimoto N, Shimoyama T, Hirano K, Yamada Y, Ishigaki Y, Kikuta H (2011) Outline of the 2011 off the Pacific coast of Tohoku earthquake (M w 9.0)—earthquake early warning and observed seismic intensity. Earth Planets Space 63:547–551. https://doi.org/10.5047/eps.2011.05.031.
Hoshiba M, Kamigaichi O, Saito M, Tsukada S, Hamada N (2008) Earthquake early warning starts nationwide in Japan. Eos Trans AGU 89(8):73–80.
Iwakiri K, Hoshiba M, Ohtake K, Shimoyama T (2012) Application of strong motion data observed in and around southern Kanto to the earthquake early warning system. Kenshin Jihou (Quart J Seismol) 75:37–59 (in Japanese with an English abstract).
Kanamori H (2008) Earthquake physics and real-time seismology. Nature 451:271–273. https://doi.org/10.1038/nature06585.
Kanamori H, Hauksson E, Heaton T (1997) Real-time seismology and earthquake hazard mitigation. Nature 390:461–464. https://doi.org/10.1038/37280.
Kawasumi H (1951) Measures of earthquake danger and expectancy of maximum intensity throughout Japan as inferred from the seismic activity in historical times. Bull Earthq Res Inst Univ Tokyo 29(3):469–482.
Kennett BLN, Engdahl ER (1991) Traveltimes for global earthquake location and phase identification. Geophys J Int 105:429–465.
Kodera Y, Yamada Y, Hirano K, Tamaribuchi K, Adachi S, Hayashimoto N, Morimoto M, Nakamura M, Hoshiba M (2018) The propagation of local undamped motion (PLUM) method: a simple and robust seismic wavefield estimation approach for earthquake early warning. Bull Seismol Soc Am 108:983–1003. https://doi.org/10.1785/0120170085.
Kurahashi S, Irikura K (2011) Source model for generating strong ground motions during the 2011 off the Pacific coast of Tohoku earthquake. Earth Planets Space 63:571–576. https://doi.org/10.5047/eps.2011.06.044.
Lay T (2017) A review of the rupture characteristics of the 2011 Tohoku-oki Mw 9.1 earthquake. Tectonophysics 733:4–36. https://doi.org/10.1016/j.tecto.2017.09.022.
Matsuoka M, Midorikawa S (1994) GIS-based seismic hazard mapping using the digital national land information. In: Proceeding of the 9th Japan earthquake engineering symposium, Tokyo, 1994 (in Japanese).
Midorikawa S, Fujimoto K, Muramatsu I (1999) Correlation of new J.M.A. instrumental seismic intensity with former J.M.A. seismic intensity and ground motion parameters. J Inst Social Safety Sci 1:51–56.
Mori J, Wald DJ, Wesson RL (1995) Overlapping fault planes of the 1971 San Fernando and 1994 Northridge, California earthquakes. Geophys Res Lett 22:1033–1036. https://doi.org/10.1029/95GL00712.
Morikawa N, Fujiwara H (2013) A new ground motion prediction equation for Japan applicable up to M9 mega-earthquake. J Disas Res 8(5):878–888.
Nakamura H, S Horiuchi CW, Yamamoto S, Rydelek PA (2009) Evaluation of the real-time earthquake information system in Japan. Geophys Res Lett 36:L00B01. https://doi.org/10.1029/2008GL036470.
Nakamura Y (1996) Real-time information systems for seismic hazards mitigation UrEDAS, HERAS, and PC. QUARTERLY REPORT-RTRI 37(3):112–127.
Nakamura Y (2004) UrEDAS, urgent earthquake detection and alarm system, now and future. Presented at the 13th world conference on earthquake engineering, Vancouver, B.C., Canada, August 1-6, 2004, Paper No. 908. Available from http://www.sdr.co.jp/paper.html.
Nakamura Y (2008) On-site alarm – the effective earthquake early warning. In: Proceeding of the 5th international conference on urban earthquake engineering, Kokuyo Hall, Tokyo.
Nakamura Y (2017) A study of damaged buildings by the Mexico earthquake. Available from DIALOG. http://www.sdr.co.jp/mexico/20170919_eq/mexico20170919eq_20171104.pdf.
Nakamura Y, Tucker BE (1988) Japan’s earthquake warning system, should it be imported to California? Calif Geol 41:33–41.
National Institute for Land and Infrastructure Management and Building Research Institute (2012) Report on field surveys and subsequent investigations of building damage following the 2011 off the Pacific coast of Tohoku earthquake. Technical note of NILIM 674/Building research data 136, Tsukuba (in Japanese with English abstract).
Ohta Y, Kobayashi T, Tsushima H, Miura S, Hino R, Takasu T, Fujimoto H, Iinuma T, Tachibana K, Demachi T, Sato T, Ohzono M, Umino N (2012) Quasi real-time fault model estimation for near-field tsunami forecasting based on RTK-GPS analysis: application to the 2011 Tohoku-Oki earthquake (Mw 9.0). J Geophys Res 117:B02311. https://doi.org/10.1029/2011JB008750.
Okada Y, Kasahara K, Hori S, Obara K, Sekiguchi S, Fujiwara H, Yamamoto A (2004) Recent progress of seismic observation networks in Japan: Hi-net, F-net, K-NET and KiK-net. Earth Planets Space 56:xv–xxviii. https://doi.org/10.1186/BF03353076.
Ozaki T (2011) Outline of the 2011 off the Pacific coast of Tohoku earthquake (Mw9.0)—tsunami warnings/advisories and observations. Earth Planets Space 63:827–830. https://doi.org/10.5047/eps.2011.06.029.
Sagiya T (2004) A decade of GEONET: 1994–2003—the continuous GPS observation in Japan and its impact on earthquake studies. Earth Planets Space 56:xxix–xxli. https://doi.org/10.1186/BF03353077.
Si H, Midorikawa S (1999) New attenuation relationships for peak ground acceleration and velocity considering effects of fault type and site condition. J Struct Constr Eng 523:63–70. https://doi.org/10.3130/aijs.64.63_2 (in Japanese with English abstract).
Strauss JA, Allen RM (2016) Benefits and costs of earthquake early warning. Seismol Res Lett 87:765–772. https://doi.org/10.1785/0220150149.
Tajima F, Kennett BLN (2012) Interlocking of heterogeneous plate coupling and aftershock area expansion pattern for the 2011 Tohoku-Oki Mw9 earthquake. Geophys Res Lett 39:L05307. https://doi.org/10.1029/2011GL050703.
Tajima F, Mori J, Kennett BLN (2013) A review of the 2011 Tohoku-Oki earthquake (Mw 9.0): large-scale rupture across heterogeneous plate coupling. Tectonophysics 586:15–34. https://doi.org/10.1016/j.tecto.2012.09.014.
Takamatsu K (2016) On-site earthquake early warning system. In: Abstract SSS01–08 presented at the JpGU-AGU Joint Session, JpGU Meeting 2016, Makuhari, Japan https://confit.atlas.jp/guide/event/jpgu2016/subject/SSS01-08.
Utsu T (1977) Seismology. Kyoritsu Shuppan Co Ltd, Tokyo (in Japanese).
Utsu T (1982) Relation between earthquake magnitude scales. Bull Earthq Res Inst 57(3):465–497 (in Japanese).
Wessel P, Smith WHF (1998) New, improved version of the generic mapping tools released. EOS Trans AGU 79:579.
Acknowledgments
The 2016 JpGU-AGU joint session on EEW held at the 2016 JpGU Annual Meeting at Makuhari Messe in Chiba/Japan led us to write this article. We thank all the participants who helped organize the session, presented papers at the oral or poster sessions, stimulated the discussion, and exchanged information. We appreciate Editor Chen Ji, and two anonymous reviewers for the review comments, which greatly improved the original manuscript. We are indebted to Yutaka Nakamura at System & Data Research Co. for providing us with the information, opinions, a scanned figure (railway damage on a diagram of magnitude vs. epicentral distance used for Fig. 5), and criticisms. We thank Peggy Hellweg at UC Bekeley for providing us with information of the ShakeAlert system network stations. She also reviewed the manuscript to verify the description of EEW developments and provided us with helpful comments. We thank Mitsuyuki Hoshiba for providing us with updated information of the JMA network including the PLUM method. We used strong-motion data from YCSMN provided by City of Yokohama, and KiK-net data by NIED. We thank Ahyi Kim at Yokohama City University for her help to access data from YCSMN. We used Generic Mapping Tools (GMT) by Wessel and Smith (1998) to draw some figures.
Funding
Not applicable.
Availability of data and materials
The KiK-net waveform data were obtained from the download site http://www.kyoshin.bosai.go.jp/kyoshin/docs/overview_kyoshin_index_en.html of NIED. Those who would like to use KiK-net data should register at https://hinetwww11.bosai.go.jp/nied/registration/ and get user ID and password. The strong-motion data of YCSMN were obtained from the download site of City of Yokohama at http://www.city.yokohama.lg.jp/somu/org/kikikanri/jisin-data/ (note this site is only in Japanese). Before accessing data, a prospective user should submit an application at http://www.city.yokohama.lg.jp/somu/org/kikikanri/jisin-data/sinsei/. The station distribution data for Fig. 2 were obtained from the JMA website for the Japanese stations (http://www.jma.go.jp/jma/en/Activities/earthquake.html) and UC Bekeley for ShakeAlert in July 2017.
Author information
Authors and Affiliations
Contributions
FT initiated and directed the review project, and TH analyzed the recent/updated data to verify the key issues addressed in the article. FT organized and wrote the manuscript while TH provided additional contributions to it. Both worked together to finalize the manuscript. Both authors read and approved the final manuscript.
Corresponding author
Ethics declarations
Competing interests
The authors declare that they have no competing interests.
Publisher’s Note
Springer Nature remains neutral with regard to jurisdictional claims in published maps and institutional affiliations.
Appendix
Appendix
Estimation of seismic intensity in the JMA EEW system
Here, the procedure of estimating the JMA intensity (scale 0, 1, 2, 3, 4, 5−, 5+, 6−, 6+ 7) in the EEW system is briefly explained. When seismic P-waves from an earthquake are detected using real-time waveform data, the hypocentral location (latitude, longitude, and depth) and JMA magnitude (Mj) are determined. Then, the JMA EEW system estimates seismic intensities at any arbitrary site as follows:
At first, the estimated Mj value is converted to MW using a simple empirical relationship (Utsu 1982)
This value of MW is used to estimate the earthquake fault length L (km: Utsu 1977)
Here, note that there was no clear definition for magnitude M in Eq. 2, and the system assumes that it is equivalent to an Mw.
Then, the minimum distance x (km) between the fault and the site is estimated as
where R is the hypocentral distance between the hypocenter and the site. When the derived x is smaller than 3 km, the value is fixed to 3 km. The peak ground velocity on the reference bedrock (PGV600: cm/s) at the site is estimated as a function of the hypocentral depth D (km) and x using the GMPE of Si and Midorikawa (1999),
Here, the “reference bedrock” is defined as a site where the S-wave velocity is 600 m/s.
The EEW system does not estimate seismic intensities for an estimated hypocentral depth of deeper than 150 km since Eq. 4 was designed to explain the attenuation characteristics of ground motions for shallow (< 50 km) earthquakes. The estimated PGV600 is converted to the peak velocity on the engineering bedrock (PGV700: cm/s) as follows:
Finally, the peak ground velocity (PGVS: cm/s) on the ground surface and the JMA seismic intensity (IJMA) are estimated as follows:
where ARV is the amplitude ratio of PGVS relative to PGV700 (amplification coefficient) and the value is determined using the average shear wave velocity in the upper 30 m (AVS30; Matsuoka and Midorikawa 1994).
In Japan, the nationwide maps of AVS30 and ARV are published by several national institutions (e.g., NIED, Geospatial Information Authority of Japan (GSI)). If an estimated intensity is equal to or greater than 5− somewhere in Japan, the EEW system issues a warning to affected areas and performs consecutive operation as long as the source information is updated.
Rights and permissions
Open Access This article is distributed under the terms of the Creative Commons Attribution 4.0 International License (http://creativecommons.org/licenses/by/4.0/), which permits unrestricted use, distribution, and reproduction in any medium, provided you give appropriate credit to the original author(s) and the source, provide a link to the Creative Commons license, and indicate if changes were made.
About this article

Cite this article
Tajima, F., Hayashida, T. Earthquake early warning: what does “seconds before a strong hit” mean?. Prog Earth Planet Sci 5, 63 (2018). https://doi.org/10.1186/s40645-018-0221-6
Received:
Accepted:
Published:
DOI: https://doi.org/10.1186/s40645-018-0221-6