- Research article
- Open access
- Published:
Diurnal cycle over a coastal area of the Maritime Continent as derived by special networked soundings over Jakarta during HARIMAU2010
Progress in Earth and Planetary Science volume 5, Article number: 64 (2018)
Abstract
This study investigates the nature and mechanisms of the diurnal precipitation system over a coastal area of the Maritime Continent (MC) by utilizing the data from a field campaign, HARIMAU2010. During the 1-month campaign, diurnal cycles over Jakarta were well identified by special networked soundings and a C-band radar. Radar and satellites captured the convective-type heavy rains that appeared in the afternoon over the array, which were followed by stratiform-type precipitation during the night. Thermodynamic budget analyses were also performed using sounding data. The period-averaged vertical profiles of Q1 and Q2 indicate that diurnal precipitation acted as deep convection in the diabatic heating and drying. The diurnal composite of the obtained parameters revealed key processes such as (1) just before the onset of the afternoon convective rain, the lower troposphere was moistened by subarray-scale processes; (2) moistening of the troposphere continued during the convective heavy precipitation; (3) the stratiform rains during the night were partly maintained by consuming the pre-existing hydrometeor aloft; and (4) in the early morning, the clouds redeveloped over the ocean to produce precipitation as well as hydrometeor aloft. The possible physical processes promoting lower-tropospheric moistening before onset of the convective rain are also discussed.

Introduction
The Maritime Continent (MC; Ramage 1968) is characterized by a mosaic of ocean regions with high sea surface temperatures and islands with various sizes, forms, and terrains. This region is well known for vigorous atmospheric convection that drives the global atmosphere (e.g., Neale and Slingo 2003) through the updraft branch of the Walker circulation (e.g., Lau and Yang 2002) and for being the source of the off-equatorward propagating signal known as the “Pacific-Japan pattern” (Nitta 1987). (See Yamanaka (2016) for a more detailed overview of MC.) Thus, understanding the nature, mechanisms, and impacts of the convection over the MC is important to understand the global climate system as well as to improve model prediction skills for the MC and the surrounding area.
Among the various convective activities over the MC, the diurnal cycle is one of the most significant signals (e.g., Yamanaka 2016). The diurnal cycle over the MC is observed via the analysis of satellite data (e.g., Nitta and Sekine 1994; Yang and Slingo 2001; Nesbitt and Zipser 2003) and shows a sharp contrast between the different diurnal phases over the land and ocean. Mori et al. (2004) further demonstrated the existence of diurnally migrating convective clouds along the coastal areas of Sumatra. This diurnal precipitation contributes to the climatological heavy rain near the coastline (e.g., Bergeman et al. 2015; Ogino et al. 2016; Ogino et al. 2017; Yamanaka et al. 2018). However, these features are still poorly reproduced by numerical simulations, especially in global circulation models with coarse horizontal resolutions (e.g., Sato et al. 2009; Love et al. 2011). Therefore, the impacts of the convection over the MC, which is dominated by the diurnal cycle, on larger-scale phenomena are still not well understood. For example, the phase of the Madden–Julian Oscillation (MJO; Madden and Julian 1972) is strongly linked to the activity of diurnal convection over the MC (e.g., Fujita et al. 2011; Peatman et al. 2014; Bergeman et al. 2015; Birch et al. 2016). Birch et al. (2016) demonstrated that the moist convections interact with the large-scale environment of the MJO via horizontal moisture flux divergence, surface heat/moisture flux, etc. However, the detailed roles of each stage of the diurnal cycle in modifying/interacting with the local atmospheric state, including lower-tropospheric moistening (e.g., Kikuchi and Takayabu 2004) and diabatic heating/drying (e.g., Kodama et al. 2006), remain unclear. Thus, more detailed investigations of the diurnal cycle and interaction with environmental fields are required, especially based on observational evidence.
The nature of the diurnal cycle over the MC was first scientifically and observationally investigated by van Bemmelen (1922), who revealed the diurnal land-sea breeze over Batavia (present-day Jakarta) using pilot balloons. For nearby locations, studies utilizing an L-band wind profiler at Serpong (see Fig. 1 for exact location) were initiated by Hashiguchi et al. (1995) to investigate the details of the diurnal cycle and were followed by various other studies (e.g., Hadi et al. 2000; Hadi et al. 2002; Araki et al. 2006). However, these studies over Jakarta were based on in situ observations at single points for the lower troposphere. The spatiotemporal structure of the nature and mechanisms of the diurnal precipitation system were studied in locations such as Sumatra (e.g., Mori et al. 2004; Sakurai et al. 2011; Kamimera et al. 2012), Borneo/Kalimantan (e.g., Houze Jr 1982; Wu et al. 2008), and New Guinea (e.g., Liberti et al. 2001; Hassim et al. 2016; Vincent and Lane 2016). These studies showed the diurnal contrast and propagation of the precipitation system and evaluated the contributing mechanisms. However, most of these studies did not emphasize the impact of the diurnal precipitation system on the thermodynamic environment, which may drive the diurnal precipitation itself as well as larger-scale phenomena. To further untangle this question, detailed observations capturing the spatiotemporal variations of both the precipitation system and the thermodynamic environment are desired.
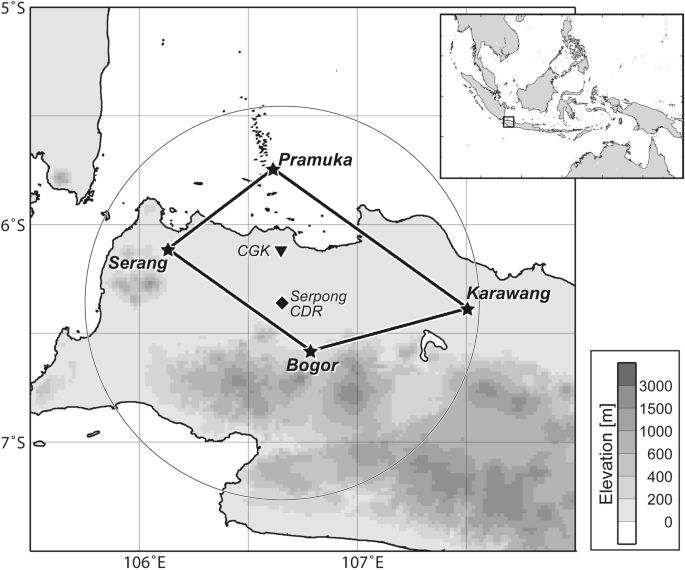
Map of the HARIMAU2010 observational area. The location of the area is designated by the small square in the large-area map in the upper-right corner. The four stars indicate the sounding stations utilized in the present study. The diamond and co-axial big circle indicate the location and observational range (105 km in radius) of the C-band radar at Serpong, respectively. The inverted triangle indicates the position of the meteorological station at CGK (Soekarno-Hatta International Airport)
To tackle these questions, we conducted an intensive field campaign named HARIMAU2010 in which we deployed a sounding network and a C-band radar around Jakarta to capture the detailed spatiotemporal variations of the atmospheric states and precipitation features for approximately 1 month (January–February 2010; for additional details, please see Mori et al. 2018 and Yamanaka et al. 2018). Utilizing the obtained sounding data, including the first-ever 2-week-long 8 times/day networked soundings over the MC, the present study aims to estimate the heat and moisture budgets and to combine these results with the radar-derived precipitation morphology to reveal the thermodynamic impacts of the diurnal cycle. Following pioneering work by Kodama et al. (2006) (hereafter K06) and more recent work by Yokoi and Sobel (2015), the present study is one of a small number of case studies of sounding-based thermodynamic budget analysis over the MC and is the first to focus on the diurnal cycle over the coastal areas where heavy rainfall occurs (Ogino et al. 2016, 2017), which is closely related to the diurnal cycle.
Methods/Experimental
The HARIMAU2010 field campaign was carried out around Jakarta for approximately 1 month in January and February 2010 (Mori et al. 2018; Sulistyowati et al. 2014; Yamanaka et al. 2018). The season was selected to be in the middle of the climatological rainy season of Jakarta, as determined by previous studies (e.g., Hamada et al. 2002).
A map of the observational area is shown in Fig. 1. The special soundings were launched at four sitesFootnote 1: Serang (6.112° S, 106.132° E) at 71 m above mean sea level (hereafter AMSL), Pramuka (5.743° S, 106.615° E) at 1 m AMSL, Karawang (6.385° S, 107.507° E) at 53 m AMSL, and Bogor (6.580° S, 106.787° E) at 248 m AMSL. Hereafter, “sounding array” or simply “array” refers to the diamond-shaped sounding array consisting of these four sites. A C-band radar was also in operation at Serpong during the study period to cover the whole array (see Fig. 1). All sites are in the vicinity of the local standard time (LST) meridian of the area (105° E) to set LST as 7 h ahead of UTC.
The special sounding data were continuously available at all four sites starting at 18 UTC on January 20, 2010,Footnote 2 and continuing for 25 days, until 00 UTC on February 15. The launch frequency was 8 times/day (3 hourly) from 00 UTC on January 24 to 00 UTC on February 7 (14 days), and 4 times/day (6 hourly) for the rest of the study period (12 days in total). We hereafter refer to the entire 25-day period as the arrayed sounding period (ASP), and the 14 days with 8 launches per day as the enhanced arrayed sounding period (EASP).
At all four sites, the Vaisala RS92-SGP sensor was used. The data at each site were interpolated in time to facilitate a 3 hourly analysis frequency, when necessary (i.e., during the 6-hourly observation period).
The budget analyses of heat and moisture were performed by applying the method of Yanai et al. (1973) to the obtained sounding dataset, as done by Katsumata et al. (2011, 2013). First, gridded fields of wind, temperature, and water vapor mixing ratio were created at 3-h intervals with a 0.25° horizontal resolution and a 25-hPa vertical resolution using a multiquadric interpolation method (Nuss and Titley 1994). These gridded fields were then used to diagnose divergence and mass-balanced vertical motions (by the method of O’Brien 1970). The tropopause was set as 100 hPa to reflect the ASP-averaged tropopause height (91 hPa). The obtained data were utilized to compute the heat and moisture budget using
where Cp is the specific heat at constant pressure; T is the temperature; P0 is equal to 1000 hPa; κ = R/Cp, where R is the gas constant; ω is the vertical pressure-velocity; θ is the potential temperature; Q1 is the apparent heat source; L is the latent heat of condensation; q is the specific humidity; and Q2 is the apparent moisture sink. The first and second terms in the right hand side for both equations are for the array-scale horizontal and vertical advections, respectively.
To further examine the obtained results and their validity, we utilized equations that integrate Eqs. (1) and (2) vertically from the tropopause to the surface. As in Yanai et al. (1973), the equations are as follows:
We combined (3) with (4) to obtain
where <x> denotes the vertical integration of x; Qr is the net radiative heating rate; S is the surface sensible heat flux; L is the latent heat of condensation; E is the surface evaporation; and P is the precipitation. However, we should note that at present, we are not yet able to acquire reliable directly observed values for S, E, or Qr for the present case. The surface flux is especially difficult to estimate with the complex land usage in this region, including rapidly developing mega-cities. Therefore, in the present study, we did not perform a quantitative evaluation as seen in previous studies (Johnson et al. 2015 is a recent example). For Qr, we utilized satellite-based estimates from the Clouds and the Earth’s Radiant Energy System (CERES) (Wielicki et al. 1996) to estimate <Qr>, although the vertical profile of Qr could not be determined.
The C-band radar, in contrast, does a full scan every 6 min to obtain a set of PPIs (so-called “volume scans”) with a range of 105 km. The data are interpolated onto a Cartesian grid with grid spacing of 1 and 0.5 km horizontally and vertically, respectively. Unobservable grid cells (obstructed by terrain, structures, etc.) were excluded from the analyses. An unobservable grid cell was identified when that cell had a small number of time steps with data values larger than 20 dBZ, which differs from all valid time steps. This thresholding was applied only at and below a height of 6 km.
In the present study, we utilized the radar data only for qualitative analysis to investigate the spatiotemporal distribution of the precipitation clouds. For quantitative analysis of surface rainfall, we utilized the TRMM 3B42 product (Huffman et al. 2007), for which measurements are available every 3 h through ASP. Unless otherwise noted, all of the analyses in the present study were performed by averaging the values inside the array (see Fig. 1).
We also utilized the brightness temperature data obtained by the infrared radiometer onboard Multi-functional Transport Satellite (MTSAT) 1R, hereafter referred to as TB (IR).
Results and discussion
Period overview
This section provides a brief overview of the meteorological situation in the ASP; more detailed descriptions of the temporal variations of the ASP are provided by Mori et al. (2018) and Sulistyowati et al. (2014).
As seen in the Hovmöller diagram of the infrared brightness temperature made from Global-IR data (Janowiak et al. 2001) (Fig. 2), the ASP was in the convectively suppressed phase of the MJO. The MJO phase indices derived by the method of Wheeler and Hendon (2004) (hereafter WH index) were mostly 7 and 8 during the ASP, except for the first 2 days (as shown in Figs. 2 and 3). Peatman et al. (2014) showed that, in phases 7 and 8, the amplitude of the diurnal cycle of rainfall around Jakarta was enhanced.

Hovmöller diagram of the infrared brightness temperature in the Global-IR dataset (Janowiak et al. 2001) and averaged between 10° S to 10° N. The white vertical line indicates the longitudinal location of the array and the ASP. The right panel shows the MJO phase index by Wheeler and Hendon (2004), with solid/open circles for amplitude equal or greater than/less than 1.0, respectively

Time–height cross sections of the sounding-derived parameters averaged over the array: a the zonal wind, b potential temperature anomaly, c moisture anomaly, d TB(IR), and e TRMM 3B42 rainrate are shown. All values are averaged over the array. Anomalies in b and c are from the average through the ASP at each pressure level. The vertical dashed black lines indicate the start and the end of the EASP. The MJO index by Wheeler and Hendon (2004) is shown on the top
Figure 3 shows the time–height cross section of the radiosonde-observed parameters averaged across the array, along with the temporal variation of TB (IR) and rainrate from TRMM 3B42. The zonal wind component in the lower troposphere, as shown in Fig. 3a, started as a strong westerly, which indicates that the ASP started after the passage of the MJO active phase. The westerly wind gradually weakened with time and became easterly after EASP ended.
Variations of temperature and moisture over the array are also shown in Fig. 3b and c, respectively. These variations are strongly dominated by the diurnal cycle, although longer-scale gradual increases of temperature and moisture are also evident. The strong diurnal variations were also captured by TB (IR), as shown in Fig. 3d. The TRMM 3B42 rain (Fig. 3e) also shows diurnal peaks, though the rainfall amount varied day to day. Similar strong diurnal cycles near Jakarta were also evident in previous studies (e.g., Araki et al. 2006).
Period-averaged Q1 and Q2
Effects of differences in period and sounding frequency
To determine the spatiotemporally averaged impact of the convection and to inspect the validity of the results of the thermodynamic budget analyses, the period-averaged vertical profiles of Q1 and Q2 were calculated, as shown in Fig. 4. We calculated temporal averages during EASP and ASP. For EASP, results using 3- and 6-hourly soundings (8 and 4 times/day, respectively) are shown.

Vertical profile of a period-averaged Q1 and Q2, and b relative standard deviation of Q1 and Q2, obtained by the budget analyses. The averaged periods are EASP and ASP. The results using 3-hourly soundings (8 times/day) and 6-hourly soundings (4 times/day) are shown for EASP
The effects of the different sampling frequencies are shown in Fig. 4. For the same EASP, the period-averaged Q1 and Q2 (Fig. 4a) were larger in results using 8 times/day soundings (thick solid lines) than that using 4 times/day soundings (thin solid lines), despite the resemblance of the vertical profiles. The differences imply that the 4 times/day soundings undersampled the diurnal variation, which typically evolves within a few to several hours (e.g., Hashiguchi et al. 1995; Araki et al. 2006). In addition, the relative standard deviation was smaller in the results based on 8 times/day soundings than those based on 4 times/day, both for Q1 and Q2. These findings suggest that the more frequent temporal sounding better captured the diurnal convection.
Differences between EASP and ASP were also found. By inspecting the 4 times/day results in Fig. 4, the Q2 profiles were shown to be similar, whereas the Q1 is larger above 600 hPa height in EASP than in ASP and vice versa (called a more “top-heavy” profile in EASP). As discussed above, the ASP includes a larger variety of background states than EASP (see Fig. 3). This difference in the background states may be reflected in the different results of the budget analyses for EASP and ASP, as previous studies (e.g., Araki et al. 2006; Peatman et al. 2014) have pointed out.
The above results suggest that the results during EASP using 8 times/day soundings are most reasonable for use in further analyses. Hereafter, the analyses and discussions are based on the results from EASP using 8 times/day soundings.
Discussion on the averaged vertical profile
Q1 and Q2 are positive throughout the troposphere. The excess of Q2 over Q1 below 600 hPa heights and vice versa above suggests that the latent heat was released largely in the lower troposphere and was transported upward by convection (although the vertical profile of Qr cannot be determined for the present case). Such a profile is generally recognized as the result of deep convective clouds (e.g., Yanai et al. 1976). In terms of the average impact at a larger scale, the observed diurnal convections behave as the “deep convective” type precipitation systems. It is reasonable to be reminded of the work of Virts and Houze Jr (2015) wherein the convective rain fraction was highest over the MC when MJO was in phase 8 in the WH index, whereas the observation period for the present study was in phases 7 to 8.
Over the western MC, K06 showed Q1 and Q2 profiles during two subsequent periods (“MJO break period”, corresponding to phases 7 to 2 in the WH index, and the subsequent “MJO active phase”, corresponding to phases 2 and 3) for two neighboring areas (over Sumatra and over the ocean at the southern end of the South China Sea). The profiles in the present study clearly differ from those in the “break” period over the ocean (area “B”) in K06. It is reasonable to observe from Fig. 4 of Peatman et al. (2014), in which the daily mean precipitation anomalies are negative over area “B” in K06 (over the South China Sea around the Equator), whereas they are near-zero in area “A” in K06 (over Sumatra) and near Jakarta (field of the present study). Compared with the other three profiles in K06, the small Q1 value (less than 2 K/day at maximum) resembles that in the “break” profile over land and the “active” profile over ocean. The peak value of Q1 in the present study was located around 500 to 400 hPa, which is between the peaks in the “break” and “active” profiles in K06. The positive Q2 throughout the troposphere in the present study is common to “active” profiles in K06. These commonalities and differences suggest the diversity of processes in different areas of the MC, and motivate further detailed studies.
We should be careful in interpreting the secondary peak of Q1 around 175 hPa. In the period-averaged vertical profiles, this height corresponds to where ∂θ/∂p increases (with more vertical gradient above that height) and ∂ω/∂p is large. These factors may cause the local peak at the height, although we here did not further investigate to identify whether this peak was an artifact of the calculation or an actual phenomenon.
With the satellite-based estimated <Qr>, the period-averaged vertically integrated budgets were inspected using Eqs. (3) and (4), as shown in Table 1. For the moisture budget, the period-averaged P from TRMM 3B42 (9.45 mm/day, equivalent to 2.49 K/day) and <Q2> (0.99 K/day) results in <Q2> − LP of 1.50 K/day, which is approximately equivalent to 170 W/m2. This value is not very different from the latent heat flux estimated for the same region in a previous study (Ilhamsyah 2014Footnote 3). However, for the heat budget, P from TRMM 3B42 (2.49 K/day), <Q1> (1.12 K/day) and <Qr> (− 0.45 K/day) results in <Q1> − <Q2> − LP of − 0.92 K/day. Assuming that the period-averaged S is positive (as in Ilhamsyah 2014), there may be missing factors or errors in the estimations, such as sampling errors (Mapes et al. 2003b). We will further examine this discrepancy in the following sections in the context of the diurnal cycle.
Diurnal cycles of observed parameters
In this section, we highlight the nature and possible mechanisms of the diurnal cycle by examining the diurnal composite of the observed/estimated parameters. Hereafter, we utilize data only for EASP (14 days). As noted in the previous section, (1) the 3-hourly soundings were better able to represent the nature and the impact of the diurnal cycle and (2) the limited period of EASP can reduce the variety of background states (see Fig. 3).
Precipitation and clouds
First, we confirmed the diurnal cycle of precipitation and clouds utilizing data from TRMM 3B42 the C-band radar, and TB (IR), averaged over the array (Fig. 5). The rainfall variation from TRMM 3B42 and the C-band radar qualitatively resembled each other, even though the rainfall data from C-band radar were obtained using a single traditional equation (Z = 200R1.6, where Z is radar reflectivity and R is the rain rate). Both data sets indicate that the diurnal peak appeared suddenly at approximately 16 LST/09 UTC, followed by a gradual decrease toward a minimum in the morning (07–13 LST/00–06 UTC).

Diurnal composite of precipitation and clouds, expressed by a spatial coverage of the infrared brightness temperature (TB(IR)) less than 230 K (black) and 270 K (gray), b the averaged TB(IR), c the rain rate from the TRMM 3B42, d the rain rate from the Serpong C-band radar, and e the vertical profile of the spatial coverage of the Serpong C-band radar echo with > 20 dBZ. All parameters are calculated within the area of the sounding array as in Fig. 1
The vertical structure of the precipitation and clouds can be seen in the time–height cross section of the radar echo areal coverage (> 20 dBZ) and TB (IR) composites. Around the time with the heaviest rainfall in the TRMM 3B42 data set (16 LST/09 UTC) (Fig. 5c), the tallest radar echoes were found (Fig. 5e). This occurrence was followed by the maximum areal coverage of TB (IR) < 230 K at 19 LST/12 UTC (Fig. 5a). These afternoon data can be reasonably identified as the deep convective-type clouds that bring heavy rain, which then formed tall clouds with highest cloud tops. After that, the echo top height gradually decreased, as seen in Fig. 5e, and the echo coverage around the 0 °C height (approximately 4 to 5 km), where the “bright band” typically appears, widened until midnight (22–01 LST/15–18 UTC). In addition, the spatial coverage of TB (IR) < 270 K (Fig. 5a) retained the highest values, which indicates that the clouds remained to be extended widely. These features correspond well with the characteristics of the developing stratiform-type precipitation cloud. Finally, the “bright band” gradually vanished by the morning (07 LST/00UTC) (Fig. 5e), and the areal coverage of TB (IR) < 230 K and < 270 K (Fig. 5a) gradually shrank to its smallest value at 14 LST/07 UTC. These diurnal variations were basically consistent with the previous studies over Jakarta (e.g., Renggono et al. 2001).
The migration of the precipitation and clouds should also be examined, because several previous studies demonstrated that convection over the coastal areas in the MC migrates diurnally (e.g., Yang and Slingo 2001; Mori et al. 2004). This phenomenon was also captured in the present case via radar, as seen in Fig. 6. In the meridional direction, that is, orthogonal to the northern coastline of Java, the dominating feature was the northward propagation of the widespread precipitating area. The area first appeared before 13 LST/06 UTC over the mountainous regions to the south of the array and then proceeded northward. The propagation speeds were approximately 5 m/s in the meridional direction. This speed resembles that of the northward-propagating precipitation of the northern coast of New Guinea simulated by Hassim et al. (2016). In the present case, the speed was faster than the averaged meridional wind component over the array (Fig. 7b). Therefore, the convection over the array likely was initiated by mechanisms other than the simple advection of preexisting precipitating clouds.

Diurnal composite of the time–latitude cross section of the radar reflectivity at a 2 km height obtained by the Serpong C-band radar. The gray shading indicates areas with no available data. The latitudinal location of the northern and southern tips of the array (Pramuka and Bogor, respectively) and the approximate locations of the coastline are shown on the right axis to indicate the latitudinal range of the array. The red line indicates the propagation speed in 5 m/s northward, as a reference

Diurnal composite of the time–height cross section, for the zonal wind (a, d), meridional wind (b, d), and horizontal divergence (c, f); a to c are the composites of the absolute values, whereas d to f are the composites of the anomalies from the 1-day running mean at each pressure level
In addition, we should note the small but southward-propagating radar echo before noon (07–13 LST/00–06 UTC) south of the coastline. The surface meteorological records at CGK (not shown) indicate that, in the EASP average, the diurnal anomaly of meridional wind became northerly at 10 LST/03 UTC. These factors suggest that the small-scale sea-breeze front with precipitating clouds moved onshore-ward and then merged onto the deep convection over the array at 16 LST/09UTC.
Sounding-derived wind fields
The diurnal variation of the array-averaged sounding-based wind field is shown in Fig. 7. On average, zonal wind (Fig. 7a) was westerly and easterly below and above 400 hPa height, respectively, and meridional wind (Fig. 7b) was southerly between 800 and 400 hPa with northerly wind above and below.
Noticeable diurnally varying features were found in the meridional component (Fig. 7b) at 13 LST/06 UTC, with a low-level northerly component (below 800 hPa) and an upper-level southerly component (between 300 and 200 hPa). The low-level northerly wind presumably corresponded to the sea breeze, which was seen in radar echo in the present study, and was observed in previous studies (e.g., van Bemmelen 1922; Araki et al. 2006). However, the upper-level southerly wind has not been described in previous studies. The height differs from the simple return flow of the sea breeze at approximately 2 km height in previous studies (e.g., van Bemmelen 1922; Hadi et al. 2002). To further highlight these variations, the diurnal composite of the diurnal anomaly (anomaly from the 1-day running mean) is shown in Fig. 7d–f. Figure 7e reveals the low-level, previously described return flow between 700 and 800 hPa, whereas an additional deep northerly anomaly extended up to 400 hPa height just below the upper-level southerly. The diurnal anomaly of the divergence (Fig. 7f) indicates that the low-level northerly layer was divergent (or weakly convergent) in anomaly, whereas the upper-level southerly layer was convergent in anomaly. Based on these factors, we can speculate that the upper-level southerly over the array was connected to the outflow from the convection to the south of the array, with downdraft compensating for the updraft in the convection.
The upward-propagating pattern of the meridional component was also found in the diurnal anomaly panel (Fig. 7e). The flips of the wind direction both in the lower and upper troposphere around 16–19 LST/09–12 UTC are reasonable in that the northward-moving convection (as seen in Fig. 6) passed over the array. An elevated southerly anomaly around 600 hPa height after 22 LST/15 UTC can be speculated to be the mid-level inflow to the stratiform precipitation that occupied the northern half of the array (see Fig. 6). The correspondence between moving convections and circulation resembles the patterns of typical mesoscale convective systems (e.g., Zhang and Gao 1989).
In the zonal component, a similar upward-propagating pattern can be seen in diurnal anomaly (Fig. 7d). In the west of the array, there is the meridionally elongated coastline of the Sumatra (see Fig. 1). It is possible that the terrain and/or terrain-induced convection over Sumatra affects the situation over the array. However, the corresponding zonally propagating convection is unclear in the radar data (not shown). In the present study, we hereafter limit our discussion to the meridional variation, which was orthogonal to the coastline, to highlight land–sea contrast.
Sounding-derived thermodynamic fields
Like the wind field in the previous subsection, the diurnal anomalies of temperature (θ′) and moisture (q′) are shown in Fig. 8, along with the vertically averaged/integrated values. These two parameters show clear diurnal variations.

Diurnal composite of potential temperature and moisture. a Potential temperature averaged for troposphere (red) and precipitable water (blue). Time–height cross section for b potential temperature and c moisture, as the anomalies from the 1-day running mean at each pressure level
In the vertically integrated values (Fig. 8a), the phases of temperature and moisture differ by approximately a quarter of a day. The maximum temperature peak in the afternoon leads the maximum moisture peak in the early evening, whereas the minimum temperature peak in the early morning leads the minimum moisture peak in the morning.
Based on the time–height panels (Fig. 8b, c), the diurnal evolution of the thermodynamic field can be recognized in the following steps: (1) From around sunrise in the early morning, the temperature starts to rise at the top and bottom of the troposphere. (2) Following the temperature, moisture starts to increase from the driest point in the morning at 10 LST/03 UTC. The layer between 700 and 900 hPa increases earlier, and the layers below and above follow. (3) The entire troposphere becomes warm and humid in the afternoon (when heavy rain begins). (4) The moisture reaches a maximum in the early evening (around 19 LST/12 UTC), when the temperature begins to decrease. (5) The atmosphere gradually becomes drier and cooler during nighttime, continuing toward the morning.
Regarding the relationship with precipitation, the temperature and moisture increase before and at the time when deep convective precipitation dominates, whereas the decrease of temperature and moisture at nighttime occur when stratiform precipitation dominates. The rise of temperature especially near the surface occurs in the daytime before onset of the deep convective precipitation, which suggests surface heating by strong insolation. It is typical that the diurnal deep convection over land begins after surface heating (e.g., Oki and Musiake 1994). However, it should be noted that the moisture peak reaches a maximum after the peak of the heavy precipitation, whereas previous modeling studies showed moisture peaks before the precipitation maximum (e.g., Sato et al. 2009). This finding implies that the processes at maximum precipitation (16–19 LST/09–12 UTC) not only consume atmospheric moisture as precipitation but also act to provide moisture. In contrast, the nighttime processes when the stratiform precipitation dominates act to consume atmospheric moisture. The details of the processes that contribute to diurnal moisture variation, as well as temperature variation, are further inspected in the next section.
Diurnal cycle of heat and moisture budgets
In this section, we examine the diurnal cycle of the results from the sounding-based thermodynamic budget analyses along with satellite-derived parameters. These investigations and discussions are based on the diurnal composite of the heat and moisture budgets, which are shown in Figs. 9 and 10, respectively. Note that in this study, we set the sign of each term to be the same as Q1 and Q2, such that a positive value is for apparent heating/drying of the atmosphere, and a negative value is for apparent cooling/moistening of the atmosphere.

Diurnal composite of each term in the thermodynamic budget analyses, for moisture; a is for the vertically integrated values of each of the terms in the thermodynamic budget analyses. Lines are labeled by strings with the same color. The black thick line with labeled “Total” is the time derivative for the amount of moisture. Broken lines labeled “<Hadv>” and “<Vadv>” are for the array-scale horizontal and vertical advection terms, respectively. The 95% confidence intervals are showed by thin vertical bars for each value and each timestep. b to e are in the time–pressure cross section, for b array-scale vertical advection, c array-scale horizontal advection, d Q2, and e the array-scale vertical air motion in pressure coordinates. Note that all of the values are positive for the heating or drying of the atmosphere (troposphere)

Same as Fig. 9, but for the heat budget. a is for the vertically integrated values of each of the terms in the thermodynamic budget analyses. b to g are in the time–pressure cross section, for b array-scale vertical advection, c array-scale horizontal advection, d Q1, e Q2, f Q1–Q2, and g the array-scale vertical air motion in pressure coordinates (same as Fig. 9e)
Moisture budget
To start from a relatively simple factor, we first inspected the moisture budget, as shown in Fig. 9. Most of the parameters were obtained via the thermodynamic budget analyses, except LP in Fig. 9a; LP is the precipitation and is identical to that in Fig. 5c (by utilizing TRMM 3B42), but converted to units of heat by multiplying by the constant of latent heating L. As pointed in the previous sections, the convective heavy precipitation suddenly began at 16 LST/09 UTC and the rainfall amount gradually decreased toward the minimum in the daytime (10–13 LST/03–06 UTC).
In terms of time, the first interesting feature in the water budget was the large negative value of total tendency at 13 LST/06 UTC, as shown in Fig. 9a. It was just before the onset of the convective heavy precipitation. The moistening was mostly dominated by <Q2>, as shown in Fig. 9a. The vertical cross section of Q2 (Fig. 9d) indicates that the moistening occurred mostly in the lower troposphere (between 900 and 700 hPa). Previous studies demonstrated that environmental moisture strongly promotes the deepening of cumuliform convection (e.g., Sherwood 1999; Takemi et al. 2004). Similar preceding lower-tropospheric moistening in the diurnal cycle over land was also reported (e.g., Shinoda and Uyeda 2002). These findings strongly suggest that such moistening plays an important role in the diurnal cycle observed in the present study. The large contribution of Q2 on the total moistening in the lower troposphere means that the moistening is associated with subarray-scale vertical transport of moisture. Later, we discuss the possible mechanisms promoting this moistening.
However, the largest moisture source at 16 LST/09 UTC, when heavy precipitation began, was array-scale vertical advection, when <Q2> was still negative, as shown in Fig. 9a. It should be noted that the total moisture tendency was still negative, which means that the moisture in the troposphere still increased when the heaviest precipitation occurred. Greater moistening by array-scale processes than by subarray-scale processes resembles the results of Masunaga (2013), in which they pointed out that the observed “large-scale” mean updraft included not only external dynamics but the local effect of convective updraft. Considering the high cloud coverage (Fig. 5a) and areal coverage of the radar echo (Figs. 5e and 6), the array-scale vertical moisture transport in the present study is estimated to include the effects induced by convective-scale updraft, which occupied a large part of the array.
In contrast, the larger negative value of Q2 than the array-scale vertical advection found below 900 hPa height can be interpreted as the effect of the large surface latent heat flux, and/or evaporative cooling of precipitation below the cloud base. Large latent heat flux is suggested also by the large negative <Q2> − LP in Fig. 9a. It is natural that the strong wind or “gusts”, which typically occur under heavily raining clouds, can increase the latent heat flux. However, the near-surface negative Q2 layer accompanies a large negative Q1 (Fig. 9d), which suggests the occurrence of evaporative cooling. Because of data shortage, in the present study, we simply point out the qualitative possibilities that remain to be further quantitatively evaluated in future study.
After the time of heaviest precipitation, the total tendency became positive (i.e., drying of the troposphere) in the nighttime (22–01 LST/15–18 UTC) when stratiform-type precipitation dominated. The total tendency was again similar to <Q2>, and the array-scale vertical advection became near-zero. Thus, the stratiform precipitating clouds consumed the moisture by subarray-scale processes. However, the Q2 during this period was positive and larger in the lower troposphere than in the upper troposphere, a so-called “bottom-heavy” type profile. This type differs from the typical “top-heavy” Q2 profile in stratiform-type precipitation (e.g., Houze Jr 1982) in which heating occurs in the upper troposphere while cooling occurs in the lower troposphere. Johnson et al. (2016) pointed out that with a larger stratiform rain fraction, the heating profile becomes more “top-heavy”. Actually, the array-scale vertical air motion (Fig. 9e) shows a two-layer structure with the updraft and downdraft (or weakened updraft) in the upper and lower halves of the troposphere, respectively, to resemble that in the typical stratiform precipitation region. It is suggested that this nighttime precipitation looks like traditional “stratiform” precipitation by some factor (radar echo, cloud, or vertical motion) but other mechanisms may be involved to result in a “bottom-heavy” Q2.
This “bottom-heavy” type Q2 profile further emerges toward the morning (04–07 LST/21–00 UTC) as in Fig. 9d. The total moisture tendency and <Q2> in Fig. 9a reaches a daily maximum in positive values (drying). The array-scale vertical advection term increases negatively toward a secondary diurnal peak. The vertical profile of the updraft (Fig. 9e) shows change in the lower troposphere from nighttime downdraft to morning updraft, which resulted in lower-tropospheric moistening associated with array-scale vertical advection (Fig. 9b). In contrast to these features, the satellite-derived precipitation (LP) continuously decreased through nighttime toward the daytime minimum (Fig. 9a).
A possible explanation for these behaviors is found in the time–latitude cross section of radar reflectivity (Fig. 6). The radar echo to the north of 6.0° S kept its strength and latitudinal extent past 04 LST/21 UTC. In contrast, the echo to the south of 6.0° S was weakened, and a corresponding gradual shrink of the echo coverage over the entire array was observed during 19–07 LST/12–00 UTC (Fig. 5e). The border latitude (6.0° S) corresponds to the location of the coastline (see Figs. 1 and 6). These results suggest that the convection gradually weakened over land (the central and southern parts of the array), whereas convection developed (or at least its life was elongated) over the ocean (the northern part of the array). Such contrast in the diurnal phase of the convective development over the ocean and land over the MC has been reported in previous studies (e.g., Nitta and Sekine 1994; Mori et al. 2004). Therefore, in the present case, the array-scale updraft and moistening by the array-scale vertical transport in the morning are presumed to be sustained by the prolonged and delayed convection over the ocean.
If so, these effects associated with convection over the ocean should be apparent with the onset of oceanic precipitation, at 16–19 LST/09–12 UTC as shown in Fig. 6. This timing is identical to when the “bottom-heavy” Q2 profile appeared (Fig. 9d). In addition, the “bottom-heavy” profile was enhanced after 01 LST/18 UTC (Fig. 9d) when the radar echo over land almost dissipated (Fig. 6) and downdraft in the lower troposphere vanished (Fig. 9e). These factors imply that the “bottom-heavy” type Q2 profile in nighttime is maintained by convection over the ocean that develops over nighttime, while the effect of the stratiform-type convections overlapped to weaken the Q2 in the lower troposphere, and made downdraft apparent in the lower troposphere.
Another interesting feature in the early morning (04–07 LST/21–00 UTC) was positive <Q2> − LP, which means downward latent heat flux according to Eq. (4). This phenomenon is discussed later.
Heat budget
Similar to the moisture budget, diurnal variation is also found in each term of the heat budget, as shown in Fig. 10, with contrast between daytime and nighttime, or convective- and stratiform-precipitation periods. The total tendency in Fig. 10a was positive (heating) in the earlier half of the daytime (07–13 LST/00–06 UTC), and turned negative when convective heavy precipitation began (16 LST/09 UTC), continuing during the nighttime (19–01 LST/12–18 UTC) when stratiform precipitation dominated. It was also found in Fig. 10a that the variation of the total tendency was in-phase with <Q1> − <Qr> − LP, equals to the surface sensible heat flux S in Eq. (3), whereas the variations of these parameters slightly led those of <Qr>. Hereafter, we trace the diurnal variation from the morning, as we did in the previous subsection for the moisture budget.
In Fig. 10a, the total tendency is positive in the morning (07–13 LST/00–06 UTC) to indicate the heating of the troposphere, with the diurnal peak at 10 LST/03 UTC. At the time, <Q2>, <Qr>, and LP are very small (near zero). Therefore, <Q1> − <Q2> − <Qr>, which equals the subarray-scale vertical transport of heat, and <Q1> − <Qr> − LP, which equals the surface sensible heat flux S, are comparable with <Q1>. In Fig. 10d, Q1 has a large positive value in the lowermost layer. These results indicate that, at the time, the sensible heat flux is estimated to be a dominant heat source at and before 10 LST/03 UTC. Remembering that the spatial coverages of the radar echo and clouds were relatively small at the time (Fig. 5), it is reasonable to infer that the morning insolation heated the land surface and resulted in large sensible heat flux.
However, at 13 LST/06 UTC, near-surface Q1 turned negative (Fig. 10d), whereas Q1 − Q2 was very large and positive, especially in the lower troposphere (Fig. 10f); <Q1> − <Q2> − <Qr> was at positive peak (Fig. 10a). These results indicate that the subarray-scale vertical transport heated up the troposphere. This finding is consistent with the results of the moisture budget in which subarray-scale moisture transport in the lower troposphere occurred at the time. In addition, downward extension of the high Q1 area (and high Q1–Q2 area) from the upper troposphere also occurred. This occurrence may have been supported by vertical subarray-scale transport.
This morning-time heating was followed by the onset of heavy convective precipitation at 16 LST/09 UTC, as observed by the radar and satellites (Fig. 5). As in Fig. 10a, it is interesting that the total tendency is near-zero (not significantly different from zero) even though the heaviest precipitation occurred at that time. Reflecting the array-scale updraft (Fig. 10g), the vertical advection term was largest in the negative to cool the troposphere. The cooling was compensated by <Q1> (Fig. 10a). Among the diabatic processes in Fig. 10a, <Q1> − <Q2> − <Qr>, which equals the subarray-scale vertical transport, acted as a principle source of heating, whereas <Qr> and <Q2> were not significantly positive. The vertical profiles of these parameters (Figs. 10b–f) indicate a peak in the middle to upper troposphere, which reflects the impact of vertically well-developed convection.
In contrast, the near-surface diabatic cooling found in Q1 may be the result of evaporative cooling, as discussed in the previous subsection, as well as the decrease of surface sensible heat flux, possibly caused by reduced surface insolation associated with overcasting convections, as seen in previous studies (e.g., Hashiguchi et al. 1995). In the present case, the surface observations at Bogor and Serpong captured the relatively weaker insolation in the afternoon than in the morning (not shown).
Most of this situation reverses at and after 19 LST/12 UTC, as in the moisture budget. During nighttime when stratiform convection dominated, the total tendency was negative, cooling the troposphere. The array-scale vertical advection term became near zero at 22–01 LST/15–18 UTC after transition at 19 LST/12 UTC. The subarray-scale vertical transport (<Q1> − <Q2> − <Qr>) and <Qr> functioned to cool the troposphere, to compensate the positive <Q2>.
On the vertical profiles, cooling signatures of Q1 were found to be smaller in between 300 and 800 hPa than above and below those heights (Fig. 10d). The prevailing stratiform cloud shield during nighttime was estimated based on radar and satellite data (as shown in Fig. 5). The areal coverage of TB(IR) < 230 K reached over 25%, which indicates that about one quarter of the array was covered by cloud tops higher than 300 hPa height. It is reasonable to assume that cooling above 300 hPa was caused by radiative cooling near the cloud tops, as in previous studies (e.g., Webster and Stephens 1980). Cooling at the uppermost layer can promote downward motion, as seen in array-scale downdraft above 200 hPa height during nighttime (Fig. 10g), as reported by Johnson et al. (1990). A downward slope of the isentropes like that of Johnson et al. (1990) was also found in Fig. 8b. In contrast, cooling below 800 hPa height was dominated by intensive cooling in Q1–Q2 (Fig. 10f). As in the discussion for the moisture budget, the results were generated by the mixture of stratiform-type clouds over land and developing clouds over the ocean. Subarray-scale mixing to cool the atmosphere was active over the nighttime ocean where the sensible heat flux was typically small.
However, in Fig. 10a, <Q1> − <Qr> − LP, which is equal to the surface sensible heat flux S in Eq. (3), was much more negative than that in a previous study of this region (Ilhamsyah 2014). A similar potential problem in the surface flux was also found in the moisture budget during the night, as pointed out in the previous subsection. This issue will be discussed in the following subsection.
At 04 LST/21 LST, the most of the parameters in Fig. 10a were near zero (i.e., the value zero was within the 95% significance interval) to transition again to the daytime situation. One exception was the large positive <Q2>, which was already discussed in the previous subsection, compensated by a combination of other factors.
Finally, in the sequential flow, we again look at the morning (07–13 LST/00–06 UTC), but for the upper troposphere. This part was characterized by positive Q1 − Q2 (Fig. 10f), which indicates radiative heating and/or subarray-scale vertical transport of heat. It is interesting that the upper-tropospheric updraft layer (centered at around 250 hPa) (Fig. 10g) was capped by the slightly high positive Q1–Q2 layer (centered at around 150 hPa). These results imply the existence of the upper-tropospheric cloud, which may cause radiative heating as well as subarray-scale vertical heat transport. These features resemble the results of a recent study by Ruppert Jr and Honenegger (2018), in which daytime radiative heating in upper-tropospheric stratiform clouds could promote updraft. Considering that in the morning, clouds existed over the ocean in the present study, the descending branch of the daytime circulation described by Ruppert Jr and Honenegger (2018) could occur over land to suppress convection over land. Such ocean–land circulation is not well resolved in the present study and should therefore be investigated in future works.
Hydrometer aloft
In the previous subsections inspecting the heat and moisture budget, parameters regarded as the surface flux were partly unnatural. One was the large negative <Q1> − <Qr> − LP during the nighttime, indicated by Eq. (3) as strong cooling by the surface sensible heat flux. The other was positive <Q2> − LP in the early morning, indicated by Eq. (4) as drying of the atmosphere by the surface latent heat flux. Sampling error (e.g., Mapes et al. 2003b) is presumed to be one reason. However, in the above cases, values were significantly non-zero (positive or negative), as shown in Figs. 9a and 10a, which suggests that random error alone is not enough to explain these unnatural values.
As a possibility to explain these values consistently, here, we examine the effect of non-precipitating liquid/solid hydrometeor aloft (hereafter “hydrometeor aloft”). Previous studies pointed out rapid changes in cloud volume and/or advection of hydrometeor into or out of a region (Johnson 1980; Johnson et al. 2015), such as in the diurnal time scale (McNab and Betts 1978). McNab and Betts (1978) estimated the effects as a few to several hundred W/m2 (equivalent to a several K/day), which is comparable to the diurnal amplitude of <Q2> − LP in the present study (Fig. 9a).
To consider the effect of the hydrometeor aloft, here, we define “precipitation” as the liquid or solid particles removed from the atmosphere toward the ground in one timestep (i.e., 3 h). For simplicity, we do not consider the ice phase here. With these assumptions, the surface precipitation P can be decomposed as
where CVR is the conversion of water vapor to precipitation; CCR is the conversion of hydrometeor aloft to precipitation. With the above definition of “precipitation”, both CVR and CCR should not be negative. In addition, we determine CVC as the conversion from water vapor to hydrometeor aloft, which can be positive (vapor to hydrometeor aloft) or negative (hydrometer aloft to vapor). However, “precipitation” in Eqs. (3) and (4) is considered as the condensates converted from the vapor and is thus equal to CVR + CVC, which differs from Eq. (6). Using these determinations, Eqs. (3) and (4) can be rewritten as:
From Eq. (7), calculated nighttime largely negative <Q1> − <Qr> − LP can be recognized as S − LCCR + LCVC < 0. To satisfy this condition, assuming S is not as negatively large as <Q1> − <Qr> − LP (i.e., <Q1> − <Qr> − LP − S < 0), CCR > CVC must be satisfied. This means that the hydrometer aloft decreases. Therefore, it is implied that the precipitation during nighttime is maintained by consuming hydrometeor aloft as well as local water vapor. This mechanism matched well with the conceptual model of the previously-proposed stratiform-type precipitation (e.g., Gamache and Houze Jr 1983). As described above, the radar and satellites captured characteristics of the stratiform-type precipitation during nighttime (Fig. 5).
In contrast, the positive <Q2> − LP in the morning (07 LST/00 UTC) indicates a positive L(− CCR + CVC − E) from Eq. (8). Assuming E ≥ 0 (latent heat flux is positive upward) and CCR ≥ 0 (raindrops fall out from the atmosphere immediately), only CVC (conversion from water vapor to hydrometeor aloft) is the possible factor to make <Q2> − LP positive, which means the production of the hydrometeor aloft at this time. In contrary, cloud cover (Fig. 5a) at that time did not increase for the < 270 K area, or even decreased for the < 230 K area. To explain these factors consistently, produced hydrometer aloft is estimated to be taken out from the array by advection, and/or, increased hydrometer aloft could exist under the pre-existing cloud tops to not increase cloud cover. Unfortunately, at present, we do not have enough data to estimate the spatiotemporal distribution of the hydrometeor, or its horizontal or vertical budget; therefore, further investigation remains for future work.
At the end of this section, we briefly discuss the unnatural period-averaged values shown in the previous section, with introducing the hydrometeor aloft. Assuming that the period-averaged S is positive, the period-averaged <Q1> − <Qr> − LP (− 0.92 K/day; see Table 1) is too large a negative value. With Eq. (7), negative <Q1> − <Qr> − LP can result if L(CCR − CVC) > S. Thus, CCR < CVC, which indicates the importance of the hydrometer aloft to the array, in the period-averaged values. As in the above discussion, the export of the hydrometeor aloft may occur at a particular time. The horizontal advection of the hydrometeor aloft should also be considered for further investigations. We expect future work to investigate this issue further.
Lower-tropospheric moistening before daytime precipitation
The large negative Q2 in the lower troposphere at 13 LST/06 UTC is considered an important feature found in the present case study; it promoted the onset of the subsequent deep diurnal convection. Here, we discuss possible mechanisms that could generate/promote this moistening.
Previous studies pointed out that the shallow cumulus moistens the lower troposphere and promotes deep convection on a diurnal scale (e.g., Shinoda and Uyeda 2002). In the present case, the C-band radar captured some scattered precipitation within the array (Figs. 5e and 6) as cloud cover reached a diurnal minimum (Figs. 5a, b). It can be recognized that narrow, shallow, but precipitating (radar-observable) clouds existed when negative Q2 was apparent. It is implied that these shallow clouds contributed to moistening the lower troposphere. Subarray-scale dry vertical mixing (dry convection, eddy transport, etc.) is also possible, although we have no clear evidence of it for the present case.
We further evaluated the possible sources promoting these shallow moist/dry convections and eddies. As pointed out in previous sections, the southward-moving signal of small precipitating areas before noon (see Fig. 6) can be recognized as the sea breeze front. The sea breeze front may lead the convection to moisten the lower troposphere, as pointed by previous studies (e.g., Bergeman and Jakob 2016). However, in the present study, a widespread precipitating area extended from the south onto the array by a non-advective mechanism, as pointed out in the previous section. This finding implies that some processes from the south promote subarray-scale vertical moisture transport.
To assess the possible processes, the diurnal composite of sounding-derived parameters at each site are shown in Fig. 11. Regarding the moisture variation (Figs. 11a–d) at the layer where large Q2 values were estimated (between 900 and 700 hPa), the moisture increased first at Bogor, the southern tip of the array, and appeared later at other sites. This offshore-ward extent of moistening did not match the characteristics of the sea breeze front, which is shown in Fig. 6 to propagate onshore-ward.

Diurnal composite of the vertical cross sections, for the water vapor mixing ratio as anomaly from the 1-day running mean (a to d) and for the meridional wind (absolute value) (e to h) at each sounding site; Pramuka (a and e), Serang (b and f), Karawang (c and g), and Bogor (d and h)
As possible offshore-ward propagating processes, previous studies proposed (1) a gravity current, or “cold pool,” originating from the convection over the inland mountains and propagating offshore-ward (e.g., Wu et al. 2008), or (2) gravity waves from the inland mountains or the convection over it (e.g., Mapes et al. 2003a; Hassim et al. 2016; Yokoi et al. 2017). Regarding the gravity current, the meridional wind in the lowermost layer is expected to be southerly. However, in the present case, the observed wind during 10–16 LST/03–09 UTC at all four sites (Fig. 11e–h), even at Bogor (southern tip of the array, Fig. 11h), was northerly, that is, onshore-ward. Low-level convergence also could not be found at the array scale (Fig. 7c, f). Therefore, a gravity current is unlikely, at least at this stage.
Regarding the possibility of gravity waves, direct evidence has not yet been found in the present case. However, the vertical moisture profile at Bogor (Fig. 11d) shows that moistening occurred earlier above 900 hPa height. This pattern resembles that observed by Yokoi et al. (2017) in which uplift by the gravity wave was likely to transport the moisture vertically. The speed of the northward extension of the precipitating area, as seen in Fig. 6, also resembles that of Yokoi et al. (2017). The diurnal anomaly of the meridional wind over the array (Fig. 7e) implies the existence of some kind of wave-like structure at the diurnal scale. These data indicate the possibility of gravity waves. We note that gravity waves may promote not only moist convection but also eddy transport, as pointed out by Bellenger et al. (2017).
In summary, in terms of the physical process to moisten the lower troposphere at 13 LST/06 UTC prior to the onset of the deep convective precipitation, the observed data indicate possibilities for (1) local subarray-scale vertical transport by cumulus/congestus clouds and/or (2) uplift by a gravity wave of convection over the mountainous area to the south of the array.
Conclusions
The field campaign HARIMAU2010, which utilized a special sounding network and a continuously operating C-band radar, successfully captured diurnal variations over Jakarta, Indonesia. The present study utilized the obtained sounding data to estimate the heat and moisture budget. With this data as well as radar and satellite data, we investigated the nature and impact of diurnal convection over a coastal area of the Maritime Continent (MC).
Diurnal variations were captured by the various observed and estimated parameters during the 25-day observation period (arrayed sounding period, or ASP), which corresponded to a convectively inactive phase of the Madden–Julian Oscillation (MJO) over the MC.
Within the ASP, a 14-day period with an increased sounding frequency of 8 times/day (enhanced ASP, or EASP) is suggested to better capture the diurnal cycle. We utilized the data measured during EASP to make a diurnal composite to identify the processes in the diurnal cycle.
The period-averaged vertical profile of diabatic heating and drying, derived from the thermodynamic budget analyses, shows typical “deep convective” patterns with a top-heavy Q1 and bottom-heavy Q2, which suggest vital subarray-scale vertical mixing. The results partly resemble those of the MJO active phase or break phase of Kodama et al. (2006) over land, which suggests the complexity of processes in different areas of the MC.
Over the array area, radar and satellites captured the onset of the deep convective-type precipitation at 16 LST/09 UTC, followed by nighttime widespread stratiform-type precipitation until dawn. The diurnal migration of the precipitation area from daytime (inland) to nighttime (offshore) observed in previous studies was also confirmed in the present case.
The radiosonde observation and its application to thermodynamic budget analysis revealed the heat and water budgets. With these results, the processes of the diurnal cycle are estimated as follows:
-
In the morning (07–10 LST/00–03 UTC), insolation under a less cloudy sky heated up the surface to heat the lowest troposphere. The temperature started to rise, while the moisture was at a diurnal minimum. Convection was initiated to the south of the array, whereas limited precipitation and decreasing cloud cover were observed over the array.
-
Around noon (13 LST/06 UTC), cloud cover and precipitation reached a minimum. In contrast, temperature and moisture greatly increased. The moistening was dominated by Q2 in the lower troposphere, with heating of the lower troposphere by Q1–Q2 simultaneously. The possible mechanisms to promote this heating and moistening in the lower troposphere are subarray-scale vertical transport by cumulus/congestus clouds, and/or uplift of the moist air by a gravity wave.
-
In the afternoon (16 LST/09 UTC), the heaviest and tallest precipitation appeared. Nevertheless, moisture continued to increase. The increase of moisture was dominated by both array-scale and subarray-scale vertical transport. The temperature, however, started to cool. In the near-surface layers, both Q1 and Q2 were negative, which suggests the evaporative cooling of precipitation under convective heavy rain.
-
In the evening (19 LST/12 UTC), most of the parameters were in transition from convective-type heavy precipitation in the evening to stratiform-type precipitation in the nighttime. Precipitation also began to appear over the ocean.
-
During nighttime but before midnight (22–01 LST/15–18 UTC), stratiform-type precipitation dominated over the array. Array-scale vertical air motion was characterized by updraft and downdraft in the upper and lower troposphere, respectively. The precipitation was partly maintained by consuming the preexisting hydrometeor aloft, as well as local water vapor. Radiative cooling may have occurred in the upper troposphere. The convection over the ocean developed and resulted in a vertical profile of Q1 or Q2 unlike that in stratiform-type precipitation.
-
In the early morning (04–07 LST/18–00 UTC), precipitation was mostly dissipated over land but was maintained over the ocean. Estimated array-scale updraft in the lower to middle troposphere may have been related to the prolonged precipitation over ocean. A certain portion of the water vapor was converted to non-precipitating hydrometeors aloft, as well as to the precipitation.
As shown above, the present study outlines the observed nature and impacts of diurnal variations over Jakarta, a coastal area of the MC, based on the first-ever 2-week-long 8 times/day networked soundings over the MC. However, this is only a case study over a limited area. Several questions remain, especially to evaluate the surface sensible/latent flux, hydrometeor aloft, and radiative heat flux. The characteristics between precipitation over land and over the ocean cannot be clearly separated. Improving the quantitative evaluation of precipitation is also an issue. The roles of physical processes such as gravity waves on heat and moisture transport are also important. Improvement of spatial and temporal resolution is especially needed to resolve each stage and process of the diurnally migrating convection in future data collection, as pointed out by modeling studies (e.g., Sato et al. 2009; Love et al. 2011).
To better quantify these factors to understand the diurnal cycle, further investigations are required. For a configuration like that in the present study over Jakarta, utilizing sounding data at CGK at the center of the array may contribute to better resolving the processes by separating the budget analyses over land and over the ocean, or by better computing the meridional cross section. However, the data available from past field experiments are limited. Future field experiments, including a recently initiated ongoing project named the Years of the Maritime Continent (YMC),Footnote 4 are expected to expand the availability of detailed and integrated data to further this investigation.
Notes
Although special radiosonde launches were also performed at one more site (CGK, as in Fig. 1), we did not use this data in the present study because (1) the potential difference of data quality due to the different sensor type used may result in erroneous estimates, as pointed out by Ciesielski et al. (2003), and (2) the lower sampling frequency (4 times/day) in the enhanced arrayed sounding period (EASP), as the sampling frequency for the other sites was 8 times/day.
Although the special observation started at 00 UTC on January 15, radiosondes were launched at all four sites continuously from 18 UTC on January 20. See Mori et al. (2018) for further details.
In Ilhamsyah (2014), the figure captions may be confused. In the present study, we assume that the panel in the upper right corner on page 32 (labeled as (b), with a vertical axis of 0 to 800) is the latent heat flux, whereas the second top panel in the left row on the same page (labeled as (c), with a vertical axis range of − 150 to 600) is the sensible heat flux.
A science plan of this project can be accessed at the following website: http://www.jamstec.go.jp/ymc/docs/YMC_SciencePlan_v2.pdf
Abbreviations
- ASP:
-
Arrayed sounding period
- BMKG:
-
Agency for Meteorology, Climatology and Geophysics, Indonesia
- BPPT:
-
Agency for the Assessment and Application of Technology, Indonesia
- CERES:
-
Clouds and the Earth’s Radiant Energy System
- CGK:
-
The three-letter code for Soekarno-Hatta International Airport
- EASP:
-
Enhanced arrayed sounding period
- EOS:
-
Earth observation system
- HARIMAU:
-
Hydrometeorological ARray for ISV-Monsoon AUtomonitoring (name of a project)
- IR:
-
Infrared
- JAXA:
-
Japanese Aerospace Exploration Agency
- JEPP:
-
Japanese EOS Promotion Plan (name of a project/fund)
- LAPAN:
-
National Institute of Aeronautics and Space, Indonesia
- LST:
-
Local standard time
- MC:
-
Maritime Continent
- MCCOE:
-
Maritime Continent Center of Excellence
- MJO:
-
Madden-Julian oscillation
- MTSAT:
-
Multi-functional Transport Satellite (a geostationary meteorological satellite of Japan)
- NASA:
-
National Aeronautics and Space Administration (United States)
- NOAA:
-
National Oceanic and Atmospheric Administration (United States)
- SATREPS:
-
Science and Technology Research Partnership for Sustainable Development (name of a fund/framework)
- TB :
-
Brightness temperature
- TRMM:
-
Tropical Rainfall Measurement Mission
- UTC:
-
Coordinated Universal Time
- YMC:
-
Years of the Maritime Continent (name of a project)
References
Araki R, Yamanaka MD, Murata F, Hashiguchi H, Oku Y, Sribimawati T, Kudsy M, Renggono F (2006) Seasonal and interannual variations of diurnal cycles of wind and cloud activity observed at Serpong, west Jawa, Indonesia. J Meteorol Soc Japan 84A:171–194
Bellenger H, Wilson R, Davidson JL, Duvel JP, Xu W, Lott F, Katsumata M (2017) Tropospheric turbulence over the tropical open ocean: role of gravity waves. J Atmos Sci 74:1249–1271
Bergeman M, Jakob C (2016) How important is tropospheric humidity for coastal rainfall in the tropics? Geophys Res Lett 43:5860–5868
Bergeman M, Jakob C, Lane TP (2015) Global detection and analyses of coastline-associated rainfall using an objective pattern recognition technique. J Clim 28:7225–7236
Birch CE, Webster S, Peatman SC, Parker DJ, Matthews AJ, Li Y, Hassim MEE (2016) Scale interactions between the MJO and the western Maritime Continent. J Clim 29:2471–2492
Ciesielski PE, Johnson RH, Haertel PT, Wang J (2003) Corrected TOGA COARE sounding humidity data: impact on diagnosed properties of convection and climate over the warm pool. J Clim 16:2370–2384
Fujita M, Yoneyama K, Mori S, Nasuno T, Satoh M (2011) Diurnal convection peaks over the eastern Indian Ocean off Sumatra during different MJO phases. J Meteorol Soc Japan 89A:317–330
Gamache JF, Houze RA Jr (1983) Water budget of a mesoscale convective systems in the tropics. J Atmos Sci 40:1835–1850
Hadi TW, Horinouchi T, Tsuda T, Hashiguchi H, Fukao S (2002) Sea-breeze circulation over Jakarta, Indonesia: a climatology based on boundary layer radar observations. Mon Weather Rev 130:2153–2166
Hadi TW, Tsuda T, Hashiguchi H, Fukao S (2000) Tropical sea-breeze circulation and related atmospheric phenomena observed with L-band boundary layer radar in Indonesia. J Meteorol Soc Japan 78:123–140
Hamada JI, Yamanaka MD, Matsumoto J, Fukao S, Winarso PA, Sribimawati T (2002) Spatial and temporal variations of the rainy season over Indonesia and their link to ENSO. J Meteorol Soc Japan 80:285–310
Hashiguchi H, Fukao S, Tsuda T, Yamanaka MD (1995) Observations of the planetary boundary layer over equatorial Indonesia with an L band clear-air Doppler radar: initial results. Radio Sci 30:1043–1054
Hassim MEE, Lane TP, Grabowski WW (2016) The diurnal cycle of rainfall over New Guinea in convection-permitting WRF simulations. Atmos Chem Phys 16:161–175
Houze RA Jr (1982) Cloud clusters and large-scale vertical motions in the tropics. J Meteorol Soc Japan 60:396–410
Huffman G, Bolvin DT, Nelkin EJ, Wolff DB, Adler RF, Gu G, Hong Y, Bowman KDP, Stocker EF (2007) The TRMM multisatellite precipitation analysis (TMPA): quasi-global, multiyear, combined-sensor precipitation estimates at fine scales. J Hydrometeorol 8:38–55. https://doi.org/10.1175/JHM560.1
Ilhamsyah Y (2014) Surface energy balance in Jakarta and neighboring region as simulated using fifth mesoscale model (MM5). Aceh Int J Sci Technol 3:27–36. https://doi.org/10.13170/AIJST.0301.03
Janowiak JE, Joyce RJ, Yarosh Y (2001) A real-time global half-hourly pixel-resolution infrared dataset and its applications. Bull Am Meteorol Soc 82:205–217
Johnson RH (1980) Diagnosis of convective and mesoscale motions during phase III of GATE. J Atmos Sci 37:733–753
Johnson RH, Ciesielski PE, Rickenbach TM (2016) A further look at Q1 and Q2 from TOGA COARE. Meteorol Monogr 56:1.1–1.12
Johnson RH, Ciesielski PE, Ruppert JH Jr, Katsumata M (2015) Sounding-based thermodynamic budgets for DYNAMO. J Atmos Sci 72:598–622
Johnson RH, Gallus WA Jr, Vescio MD (1990) Near-tropopause vertical motion within the trailing stratiform region of a midlatitude squall line. J Atmos Sci 47:2200–2210
Kamimera H, Mori S, Yamanaka MD, Syamsudin F (2012) Modulation of diurnal rainfall cycle by the Madden–Julian oscillation based on one-year continuous observations with a meteorological radar in West Sumatera. SOLA 8:111–114
Katsumata M, Ciesielski PE, Johnson RH (2011) Evaluation of budget analyses during MISMO. J Appl Meteorol Climatol 50:241–254
Katsumata M, Yamada H, Kubota H, Moteki Q, Shirooka R (2013) Observed evolution of northward-propagating intraseasonal variation over the western Pacific: a case study in boreal early summer. Mon Weather Rev 141:690–706
Kikuchi K, Takayabu YN (2004) The development of organized convection associated with MJO during TOGA COARE IOP: Trimodal characteristics. Geophys Res Lett 31:L10101. https://doi.org/10.1029/2004GL019601
Kodama YM, Tokuda M, Murata F (2006) Convective activity over the Indonesian maritime continent during CPEA-I as evaluated by lightning activity and Q1 and Q2 profiles. J Meteorol Soc Japan 84A:133–149
Lau KM, Yang S (2002) Walker circulation. In: North GR (ed) Encyclopedia of atmospheric sciences, 2nd edn. Elsevier, New York.
Liberti GL, Cheruy F, Desbois M (2001) Land effect on the diurnal cycle of clouds over the TOGA COARE area, as observed from GMS IR data. Mon Weather Rev 129:1500–1517
Love BS, Matthews AJ, Lister GMS (2011) The diurnal cycle of precipitation over the maritime continent in a high-resolution atmospheric model. Q J R Meteorol Soc 137:934–947
Madden RA, Julian PR (1972) Description of global-scale circulation cells in the tropics with a 40–50 day period. J Atmos Sci 29:1109–1123
Mapes BE, Ciesielski PE, Johnson RH (2003b) Sampling errors in rawinsonde-array budgets. J Atmos Sci 60:2697–2714
Mapes BE, Warner TT, Xu M (2003a) Diurnal patterns of rainfall in northwestern South America. Part III: diurnal gravity waves and nocturnal convection offshore. Mon Weather Rev 131:830–844
Masunaga H (2013) A satellite study of tropical moist convection and environmental variability: a moisture and thermal budget analyses. J Atmos Sci 70:2443–2466
McNab AL, Betts AK (1978) Mesoscale budget study of cumulus convection. Mon Weather Rev 106:1317–1331
Mori S, Hamada JI, Tauhid YI, Yamanaka MK, Okamoto N, Murata F, Sakurai N, Hashiguchi H, Sribimawati T (2004) Diurnal land-sea rainfall peak migration over Sumatera Island, Indonesian maritime continent, observed by TRMM satellite and intensive rawinsonde soundings. Mon Weather Rev 132:2021–2039
Mori S, Hamada JI, Wu PM, Hattori M, Katsumata M, Endo N, Ichiyanagi K, Hashiguchi H, Arbain AA, Sulistyowati R, Lestari S, Syamsdin F, Manik T, Yamanaka MD (2018) Meridional march of diurnal precipitation over Jakarta, Indonesia, observed with a C-band Doppler radar: An overview of HARIMAU2010 campaign. Prog Earth Planet Sci 5:47
Neale R, Slingo J (2003) The MC and its role in the global atmosphere: a GCM study. J Clim 16:834–848
Nesbitt SW, Zipser EW (2003) The diurnal cycle of rainfall and convective intensity according to three years of TRMM measurements. J Clim 16:1456–1475
Nitta T (1987) Convective activities in the tropical western Pacific and their impacts on the northern hemisphere summer circulation. J Meteorol Soc Japan 65:165–171
Nitta T, Sekine S (1994) Diurnal variation of convective activity over the tropical western Pacific. J Meteorol Soc Japan 72:627–641
Nuss WA, Titley DW (1994) Use of multiquadric interpolation for meteorological objective analysis. Mon Weather Rev 122:1611–1631
O’Brien JJ (1970) Alternative solutions to the classical vertical velocity problem. J Appl Meteorol 9:197–203
Ogino SY, Yamanaka MD, Mori S, Matsumoto J (2016) How much is the precipitation amount over the tropical coastal region? J Clim 29:1231–1236
Ogino SY, Yamanaka MD, Mori S, Matsumoto J (2017) Tropical coastal dehydrator in global atmospheric water circulation. Geophys Res Lett 44:11636–11643. https://doi.org/10.1002/2017GL075760
Oki T, Musiake K (1994) Seasonal change of the diurnal cycle of precipitation over Japan and Malaysia. J Appl Meteorol 33:1445–1463
Peatman SC, Matthews AJ, Stevens DP (2014) Propagation of the Madden-Julian oscillation through the MC and scale interaction with the diurnal cycle of precipitation. Q J R Meteorol Soc 140:814–825
Ramage CS (1968) Role of a tropical "maritime continent" in the atmospheric circulation. Mon Weather Rev 96:365–370
Renggono F, Hashiguchi H, Fukao S, Yamanaka MD, Ogino SY, Okamoto N, Murata F, Harijono SWB, Kudsy M, Kartasasmita M, Ibrahim G (2001) Precipitating clouds observed by 1.3-GHz L-band boundary layer radars in equatorial Indonesia. Ann Geophys 19:889–897
Ruppert JH Jr, Honenegger C (2018) Diurnal circulation adjustment and organized deep convection. J Clim 31:4899–4916
Sakurai N, Mori S, Kawashima M, Fujiyoshi Y, Hamada JI, Shimizu S, Fudeyasu H, Tabata Y, Harjupa W, Hashiguchi H, Yamanaka MD, Matsumoto J, Emrizal, Syamsudin F (2011) Migration process and 3D wind field of precipitation systems associated with a diurnal cycle in west Sumatera: dual Doppler radar analyses during the HARIMAU2006 campaign. J Meteorol Soc Japan 89:341–361
Sato T, Miura H, Satoh M, Takayabu YN, Wang Y (2009) Diurnal cycle of precipitation in the tropics simulated in a global cloud-resolving model. J Clim 22:4809–4826
Sherwood SC (1999) Convective precursors and predictability in the tropical western Pacific. Mon Weather Rev 127:2977–2991
Shinoda T, Uyeda H (2002) Effective factors in the development of deep convective clouds over the wet region of eastern China during the summer monsoon season. J Meteorol Soc Japan 80:1395–1414
Sulistyowati R, Hapari RI, Syamsudin F, Mori S, Oishi ST, Yamanaka MD (2014) Rainfall-driven diurnal variations of water level in Ciliwung River, West Jawa, Indonesia. SOLA 10:141–144
Takemi T, Hirayama O, Liu C (2004) Factors responsible for the vertical development of tropical oceanic cumulus convection. Geophys Res Lett 31:L11109. https://doi.org/10.1029/2004GL020225
van Bemmelen W (1922) Land- und Seebrise in Batavia. Beitr Phys Frei Atmos 10:169–177 (in Germany)
Vincent CL, Lane TP (2016) Evolution of the diurnal precipitation cycle with the passage of a Madden-Julian Oscillation event through the Maritime Continent. Mon Weather Rev 144:1983–2005
Virts KS, Houze RA Jr (2015) Variation of lightning and convective rain fraction in mesoscale convective systems of the MJO. J Atmos Sci 72:1932–1944
Webster PJ, Stephens GL (1980) Tropical upper-tropospheric extended clouds: inferences from winter MONEX. J Atmos Sci 37:1521–1541
Wheeler MC, Hendon HH (2004) An all-season real-time multivariate MJO index: development of an index for monitoring and prediction. Mon Weather Rev 132:1917–1932
Wielicki BA, Barkstrom BR, Harrison EF, Lee RB III, Smith GL, Cooper JE (1996) Clouds and the earth's radiant energy system (CERES): an earth observing system experiment. Bull Am Meteorol Soc 77:853–868
Wu PM, Yamanaka MD, Matsumoto J (2008) The formation of nocturnal rainfall offshore from convection over western Kalimantan (Borneo) Island. J Meteorol Soc Japan 86A:187–203
Yamanaka MD (2016) Physical climatology of Indonesian maritime continent: an outline to comprehend observational studies. Atmos Res 178–179:231–259
Yamanaka MD, Ogino SY, Wu PM, Hamada JI, Mori S, Matsumoto J, Syamsudin F (2018) Maritime continent coastlines controlling Earth’s climate. Prog Earth Planet Sci 5:21
Yanai M, Chu JH, Stark TE, Nitta T (1976) Response of deep and shallow tropical MC cumuli to large-scale processes. J Atmos Sci 33:976–991
Yanai M, Esbensen S, Chu JH (1973) Determination of bulk properties of tropical cloud clusters from large-scale heat and moisture budgets. J Atmos Sci 30:611–627
Yang GY, Slingo J (2001) The diurnal cycle in the tropics. Mon Weather Rev 129:784–801
Yokoi S, Mori S, Katsumata M, Geng B, Yasunaga K, Syamsudin F, Nurhayati N, Yoneyama K (2017) Diurnal cycle of precipitation observed in the western coastal area of Sumatra Island: offshore preconditioning by gravity waves. Mon Weather Rev 145:3745–3761
Yokoi S, Sobel AH (2015) Intraseasonal variability and seasonal march of the moist static energy budget over the eastern Maritime Continent during CINDY2011/DYNAMO. J Meteorol Soc Japan 93A:81–100
Zhang DL, Gao K (1989) Numerical simulation of an intense squall line during 10-11 June 1985 PRE-STORM. Part II: rear inflow, surface pressure perturbations and stratiform precipitation. Mon Weather Rev 117:2067–2094
Acknowledgements
The authors acknowledge all who were engaged in the HARIMAU2010 field campaign, especially BPPT, BMKG, and LAPAN. Comments and suggestions from the editor and four anonymous reviewers were essential to improve the manuscript. The MTSAT-1R data were converted and provided by Kochi University. The TRMM data were provided by JAXA and NASA. The Global-IR data were generated by NOAA and provided by NASA. The CERES data were provided by NASA. The MJO phase index by the method of Wheeler and Hendon (2004) was provided by the Bureau of Meteorology, Australia.
Funding
The present work, including the HARIMAU2010 field campaign and analyses of the obtained data, was supported in part by the projects Japanese Earth Observation System Promotion Program - Hydrometeorological Array for Intraseasonal Variation - Monsoon Automonitoring (JEPP-HARIMAU), and Science and the Technology Research Partnership for Sustainable Development - Maritime Continent Center of Excellence (SATREPS-MCCOE).
Availability of data and materials
The datasets analyzed in the current study are available from the corresponding author on request.
Author information
Authors and Affiliations
Contributions
SM proposed the topic of this study, including both observation and analyses. All authors contributed to design, prepare, and execute the field campaign. SM processed the ground-based radar data. MK processed and analyzed the other data, composed the manuscript, and led the discussion. All authors contributed to the discussion of the results, and read and approved the final manuscript. MDY was the principal investigator of the JEPP-HARIMAU and SATREPS-MCCOE projects.
Corresponding author
Ethics declarations
Competing interests
The authors declare that they have no competing interests.
Publisher’s Note
Springer Nature remains neutral with regard to jurisdictional claims in published maps and institutional affiliations.
Rights and permissions
Open Access This article is distributed under the terms of the Creative Commons Attribution 4.0 International License (http://creativecommons.org/licenses/by/4.0/), which permits unrestricted use, distribution, and reproduction in any medium, provided you give appropriate credit to the original author(s) and the source, provide a link to the Creative Commons license, and indicate if changes were made.
About this article

Cite this article
Katsumata, M., Mori, S., Hamada, JI. et al. Diurnal cycle over a coastal area of the Maritime Continent as derived by special networked soundings over Jakarta during HARIMAU2010. Prog Earth Planet Sci 5, 64 (2018). https://doi.org/10.1186/s40645-018-0216-3
Received:
Accepted:
Published:
DOI: https://doi.org/10.1186/s40645-018-0216-3