- Research article
- Open access
- Published:
Classification of topography for ground vulnerability assessment of alluvial plains and mountains of Japan using 30 m DEM
Progress in Earth and Planetary Science volume 8, Article number: 3 (2021)
Abstract
This study aims to create a terrain classification of Japan that allows both geomorphological and geoengineering classifications coexist without large contradictions and to distinguish landform elements even in urban plains which include noise associated with digital elevation models (DEMs). Because Japan is susceptible to natural disasters, we designed the classification to reflect the ground vulnerability of both alluvial plains and mountains through the application of terrain classification data to landslide susceptibility and seismic zoning. We updated an existing DEM-based terrain classification method for application in the high-resolution 30 m DEM. We used topographic measurements that do not amplify manmade unevenness or noise, which are usually the main problems associated with the use of high-resolution DEMs with high vertical accuracies. We selected the height above the nearest drainage (HAND), slope gradient, surface texture, and local convexity as geometric signatures, which were devised so as not to detect noise. Segment polygon data of terrain units were derived from the raster data of slope and HAND. The polygon data were classified into 40 clusters using the attributes of slope, HAND, and surface texture; then they were grouped into 16 legends following comparisons with the existing geological and geomorphological maps and supplementary reclassification by HAND and local convexity. The derived terrain classification, except for manmade cuts and fills, showed similarities with the existing expert-driven maps and some association with areas where shallow landslides or floods frequently occur. Based on a trial in California using a 30 m DEM, we concluded that the proposed method can be adopted in other regions outside of Japan.

1 Introduction
Geomorphological maps that delineate the topography of similar shapes and similar formation processes have been produced in many countries to estimate the ground strength and establish plans for flood and sediment disaster prevention and regional development. To create a geomorphological map, experts classify the topography by interpolating aerial photographs and other data such as satellite imagery and then clarify the differences in causes, constituent materials, and time of formation using field surveys and other references. However, this type of labor-intensive work is not feasible over a wide area. Around the 1990s, Pike (1988) and Dikau et al. (1991) proposed computer-based methods of automated classification of topography by terrain measurements using digital elevation models (DEMs) (hereafter, terrain classification). Since then, many geomorphological classification methods ranging from landform elements of mountain slopes (MacMillan et al. 2000, 2003; Reuter et al. 2006; Jasiewicz and Stepinski 2013) to landform patterns (Prima et al. 2006; Saadat et al. 2008) have been developed, and geomorphological mapping of global physiography at various scales has been proposed for several applications (Meybeck et al. 2001; Iwahashi and Pike 2007; Drăguţ and Eisank 2012; Sayre et al. 2014; Iwahashi et al. 2018a).
Global terrain classification using DEMs with resolutions of 1 km (Iwahashi and Pike 2007) and 280 m (Iwahashi et al. 2018a) has been performed by three geometric signatures, i.e., slope gradient, surface texture (spatial density of pits and peaks [ridges and valleys] extracted by the median filter), and local convexity (spatial density of convex points extracted by the Laplacian filter). Iwahashi and Pike (2007) classified the terrains by threshold processing using the raster data of the three geometric signatures (Fig. 1). Applications of this pixel-based terrain classification are mainly proxy for site classes of earthquake shaking (Yong et al. 2012; Irsyam et al. 2017; Parker et al. 2017), or for soil type estimation (European Commission – DG JRC 2008).

Outline of the classification method of Iwahashi and Pike (2007)
Geological maps have been produced in many countries, but the emphasis is on lithological and chronological classification. There are few maps edited for engineering use, such as to capture differences between land in populated areas (e.g., alluvial fans and flood plains), or to reflect civil and geological features (e.g., soft and hard rock in mountainous areas). Since the landform classes indicate landform materials and are one of the most appropriate proxies (Wakamatsu and Matsuoka 2013; Hengl et al. 2017), the automated terrain classification maps using DEMs, which were modeled after the current geomorphological maps, are often used to estimate earthquake shaking and soil distribution. Note that terrain classifications using DEMs are used to analyze and describe the morphological features of topography regardless of their causes and are strictly different in nature from expert geomorphological maps. Moreover, topography is not a substitute for geological field surveys or field measurements. However, by quantitatively classifying and describing the topography using a DEM, it is possible to obtain an overview of the ground in a wide area efficiently and quickly, which would be helpful in preliminary engineering investigations.
Iwahashi et al. (2018a) used polygon data in terrain units rather than cells to avoid the effects of DEM noise, which was already evident on the 280 m resolution DEM, and grouped the data corresponding to existing geomorphological and geological maps. This method was inspired by the experience of integrating land and seafloor DEMs with widely varying accuracies and resolutions and to create automated terrain classification of sea-land (Iwahashi et al. 2015). The method of Iwahashi et al. (2018a) can be summarized as follows. First, area segmentation is performed using the logarithmic value of the slope gradient and local convexity calculated from the DEM. Then, by adding the surface texture, k-means clustering (MacQueen 1967) is performed, and the polygons are grouped into 40 clusters. Iwahashi et al. (2018a) attempted the reclassification and grouping using local information from Japan as a test case. The 40 clusters were compared with Japanese geological and geomorphological data and reclassified into 12 groups with different geomorphological and geological characteristics. In addition, mountains and hills were subdivided using the combined texture data. Finally, 15 groups were created as terrain groups.
Compared to the method of Iwahashi and Pike (2007), which is an unsupervised and minimalistic simple process (Fig. 1), the method described in Iwahashi et al. (2018a) is a combination of unsupervised and supervised processes with additional reclassification (Fig. 2). The classification of Iwahashi et al. (2018a) is an improved version of those reported in previous studies that used 1 km DEMs, especially for representing the terrace shapes and landform elements smaller than 1 km. The results were suitable for distinguishing bedrock mountains, hills, large highland slopes, intermediate landforms (plateaus, terraces, and large lowland slopes), and plains. The dataset of Iwahashi et al. (2018a) is reported to have been effective for the Italian zoning of Vs30 (average shear wave velocity for the top 30 m) with the exception of rocky sub-flat areas (Mori et al. 2020). However, in Japan, the description of geometric signatures is limited for detecting narrow valley bottom plains, landform elements in metropolitan areas, and natural levees in flood plains. The classifications of alluvial plains were not sufficient in 1 km DEM where the resolution was coarse for landform description and in 280 m DEM where artificial (manmade) modifications were clearly visible. A new method to use high-resolution DEMs with high vertical accuracy is required for more practical applications. For example, in Japan, as in many other countries, original regional geological and geomorphological maps are often drawn at a scale of 1:50,000 or 1:25,000. At a minimum, a DEM with a resolution of about 30 m (0.6–1.2 mm on the maps) is likely to be required to obtain results for these scale maps. However, as Pelletier (2013) pointed out, it is difficult to develop automated terrain classification using DEMs on plains because of the need for high-resolution DEMs with high vertical accuracies. As the resolution of the DEM increases, the unevenness of manmade modifications, such as terraced fields, becomes more clearly visible. With such high-resolution data, topographic measurements calculated using adjacent elevation points would not be representative of the slope. Therefore, higher-resolution DEMs do not necessarily solve the geomorphological and hydrological problems because of scale issues (Zhang and Montgomery 1994; Deng et al. 2007; Mulder et al. 2011). Moreover, some topographic measurements show a strong influence of the unevenness of the point density of elevations in high-resolution DEMs. Figure 3 shows topographic measurements of a merged DEM with different sources. The light detection and ranging (LiDAR) DEM taken from airborne platforms has a high density of measured elevation points as a data source, but the contour lines have coarse nodes that reflect general topography. Surface texture expresses the density of the extracted pits and peaks using a filter for noise detection (the median filter), and here, the density is calculated by picking up all pits and peaks above zero. Figure 3 shows that unevenness of surface textures was found to be strongly amplified at a 10 m resolution and slightly amplified at a 30 m resolution, but not amplified at a 90 m resolution. This indicates that topographic measurements using noise-amplified kernels are affected by the differences in source-elevation density, except for the case that the DEM resolution is so coarse that the differences do not matter. On the contrary, such a phenomenon is not apparent in the slope-gradient images that use first-order derivative kernels and have a small noise amplification effect. Thus, automated classification of topography using high-resolution DEMs is a “fight against noise and scale issues.” Figure 4 shows the flowchart of automated terrain classification using DEMs and the problems that occur along the process (red letters).
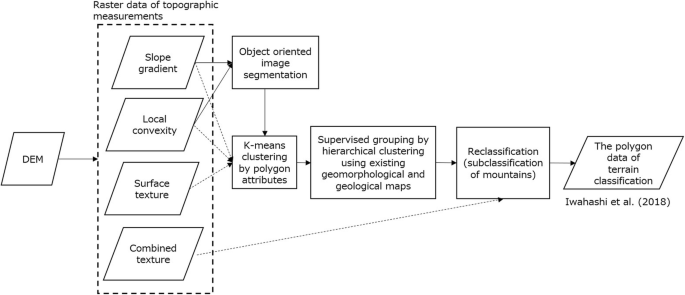
Outline of the classification method of Iwahashi et al. (2018a)

Images of surface texture and slope gradient in different grid sizes of DEMs. Using the fundamental geospatial data (FGD; GSI), around Mt. Sanage, Aichi Prefecture

Flowchart of terrain classification using DEM with noise and scale problems (red notes). This flowchart assumes the process of Iwahashi et al. (2018a)
Some local problems are beyond the noise or scale issues. In recent years, under the influence of global climate change, the number of extreme rainfall events in Japan has increased, and landslide disasters have occurred frequently (Saito et al. 2014). The vulnerability of mountain slopes can lead to landslides, but it is difficult to understand the susceptibility from conventional geological maps that focus on age classification. Terrain attributes such as slope gradients affect the vulnerability to landslides. However, current Japanese geomorphological maps (the land condition map of the Geospatial Information Authority (GSI) only classify mountainous areas into “mountains,” “volcanic areas,” and “hills,” and do not indicate the vulnerability to hazards.
This study aims to develop a classification method that can distinguish landform elements even in urban plains and mountains. This method is used to produce a map of Japan in which geomorphological and geoengineering classifications coexist without large contradictions, and the classification of topography reflects the ground vulnerability of both alluvial plains and mountainous areas, enabling landslide susceptibility zoning.
2 Methods
2.1 Study area and DEM
The study area is the entire country of Japan (total area ~ 378,000 km2) (Fig. 5). Japan consists of many mountainous islands as a chain in the Pacific Ocean’s Ring of Fire. Megalopolises such as Tokyo make up densely inhabited district (DID) areas in plains. The natural landforms of Japan can be divided into five categories: volcanoes, mountains (excluding volcanoes), hills, terraces, and lowlands (Suzuki 1997). Most of the urban coastal areas of the country are filled with reclaimed land or high fills, and there are many cuts and fills in settlement areas and agricultural land. The mountains are on younger orogenic belts and composed of Cretaceous to Paleogene felsic volcanic rock and accretionary complexes (western Japan) or Neogene sedimentary and volcanic rock (eastern Japan) (Wakita 2013). Most of Japan lies on the monsoon climate zone with warm and humid weather. Annual average precipitation in Japan is approximately 700 to 4500 mm and is around 2000 mm in many areas (Japan Meteorological Agency 2020).

Main islands of Japan and the central portion of Honshu Island. The shaded relief image of the central portion of Honshu Island (within the black framework) shows the locations of large cities, densely inhabited district (DID), and active volcanoes
The mountains of Japan are steep watersheds that experience frequent slope failures and landslides (Oguchi et al. 2001). Sediments from these mountains are deposited in plains, forming alluvial fans and plains. Japan is regularly impacted by natural disasters such as frequent earthquakes and typhoons (e.g., Mid Niigata Prefecture Earthquake in 2004 (Sato et al. 2005), the 2011 off the Pacific coast of Tohoku Earthquake (often called Eastern Japan Great Earthquake or Great East Japan Earthquake and Tsunami) (Okada et al. 2011), landslides caused by the heavy rainfalls in Hiroshima City in August 2014 (Wang et al. 2015), the 2016 Kumamoto Earthquake (Matsunaga et al. 2019), and Matsunaga et al. 2019 Typhoon Hagibis (NHK WORLD-JAPAN 2019)). In these disasters, various ground disasters such as landslides, liquefaction, and flooding occurred.
A 30 m resolution DEM of Japan was created by projection transformation from 1 arc-second grid elevation data (Yamazaki et al. 2018) based on fundamental geospatial data (FGD; provided by GSI) by taking a composite of different resolution elevation data and taking the mean elevation for 1 arc-second pixels. The FGDs are produced from 0.2″ (approximately 5 m) DEMs of airborne LiDAR or photogrammetry and 0.4″ (approximately 10 m) DEMs of topographic contours of 1:25,000 scaled maps (Fig. 6). The FGDs are updated as the number of airborne LiDAR surveying regions increases. The DEMs used in this study (Yamazaki et al. 2018) were downloaded in December 2017. The 1″ grid elevation data were aggregated with the all-touch option; thus, the cells adjacent to the water bodies are labeled as “NoData.”

Types of the source data of the DEM (FGD) used in this study
2.2 Preliminary considerations and topographic measurements
Similarly to FGDs, DEMs are constantly revised with the advances in measurement methods such as LiDAR. Hence, DEM-based terrain classification maps should be revised accordingly. Therefore, a simple method that provides an easy understanding of the contribution of the parameters and reproduces the terrain classification data is needed. Existing geomorphological maps are not necessarily classified by topography alone; moreover, there are differences in the interpretation and definition of map legends depending on the purpose of use, investigators, and scales of maps. Classification data of landform elements of mountains at the national level is not available for Japan. Therefore, it is difficult to annotate training data, and a method that does not require training data is needed. A reproducible unsupervised machine learning method that does not combine many topographic parameters is appropriate. Thus, our focus was to use existing knowledge to develop an automated or semi-automated classification that can be used widely by researchers and engineers with limited resources and can produce maps that are useful for disaster management.
To improve the terrain classification method for plain areas using higher-resolution DEMs, the methods of topographic measurements for which DEM unevenness or noise is not amplified can be listed as follows.
1) First- or low-order derivatives
-
Elevation and specific height from criteria such as channel networks
-
Slope gradient
2) Adjustments to the DEM or topographic measurements
-
Coarsening the DEM resolution/smoothing the DEM
-
Enlarging the window size so as not to reflect fine noise (may have the same effect as in Iwahashi et al. 2012)
-
Raising the threshold of the landform element extraction for topographic measurements, which use noise-like elements such as surface texture
As for the first- or low-order derivatives, we used the height above the nearest drainage (HAND) model (Rennó et al. 2008) in addition to the slope gradient. HAND can identify plains close to rivers such as valley bottom plains and alluvial plains and can detect low terraces, gentle alluvial fans, and natural levees in alluvial plains, even in urban areas with significant manmade unevenness (Iwahashi et al. 2018b). In addition, HAND is useful for identifying very flat terraces at high resolution that are difficult to identify by slope gradient and surface texture, especially in small window sizes for calculations. HAND changes its spatial pattern depending on the threshold to extract the drainage lines from a DEM. In this study, Terrain Analysis Using Digital Elevation Models (TauDEM; Tarboton 2005) was used to calculate HAND. We calculated HAND following the method in Liu et al. (2016); however, we used D-infinity method (Tarboton 1997) for the extraction of the drainage lines (threshold 150,000). This threshold may not be stable, as it is expected to vary with different resolution DEM and HAND calculation methods, but it is the value used to extract major Japanese rivers. In the case of islets without large rivers, the HAND value matches the elevation. HAND suggests relative height from current erosion standards.
The image of the slope gradient, the first derivative of elevation, does not strongly emphasize noise (Fig. 3). The slope gradient was calculated using the SLOPE command in ArcGIS Spatial Analyst (ESRI) in 3 × 3 cell windows.
As for the adjustments to the DEM or topographic measurements, we improved the methods of Iwahashi and Pike (2007) and Iwahashi et al. (2018a), which used noise amplification type signatures, surface texture, and local convexity. We enlarged the window size and raised the threshold of landform element extraction while maintaining the quality of DEMs. The surface texture is the density of pits and peaks (ridges and valleys) derived from the DEMs (Iwahashi and Pike 2007). The pits and peaks were extracted from the difference between the median filtered DEM (calculated in 3 × 3 cell windows) and original DEM. The default threshold of the pits and peaks was zero. The density was calculated in 10 cell windows as a mean value. Since it was difficult to reduce the noise by changing the window size when extracting pits and peaks, we reduced the noise by raising the threshold when extracting pits and peaks. The threshold was raised to the extent that unevenness of plain parts, such as riverbanks, was not picked up. This experiment was conducted in the Kanto Plain (Fig. 5), which has the most intense artificial modification and frequent large continuous embankments. A threshold height of 5 m, at which point the pits and peaks of embankment of the Tone River (largest river in the Kanto Plain) almost disappeared, was used.
Local convexity (Iwahashi and Pike 2007; Iwahashi et al. 2018a) was obtained by processing a DEM using the Laplacian or Laplacian-of-Gaussian kernel (LOG; Marr and Hildreth 1980), and the four-neighborhood Laplacian filter within 3 × 3 cell windows as a default kernel, and by calculating the spatial density of a cell with a result larger than a specified threshold value (default 0 m) within a specified range (default 10 cells radius). When using local convexity, unlike surface texture, it was not possible to efficiently remove manmade high embankments using only the threshold. Then, the window sizes of the LOG kernels (and calculation ranges of the convex points in cells radius), 3 × 3 (10 cells radius), 5 × 5 (15 cells radius), 7 × 7 (20 cells radius), and 13 × 13 (40 cells radius), and the threshold values of 0, 0.5, and 1 m for extracting convex points were examined. The LOG kernels followed the method described in Iwahashi et al. (2012). The 7 × 7 window size (range: 20 cells radius) with 0 m threshold, which revealed the terrace surfaces most clearly, was adopted.
Finally, the datasets of geometric signatures (HAND, slope gradient, modified surface texture, and modified local convexity) were prepared using the topographic measurements of the 30 m DEM of Japan. Following the method of Iwahashi et al. (2018a), logarithmic values (ln) of the slope gradient (lnSLOPE) were calculated. The spatial densities (modified surface texture and modified local convexity) were used as raw values (TEXTURE and CONVEXITY, respectively). We also calculated the logarithmic values (ln) of HAND to emphasize the topography of gentle slopes (lnHAND). Table 1 shows the descriptions of the four geometric signatures.
2.3 Areas to be excluded from the classification using DEM
Widespread manmade land with high embankments was assumed to have a significant effect on the statistical results. Considering the objectives of this study, the overestimation of ground strength was particularly problematic; thus, high embankments along the coast were mistaken for old terraces (Iwahashi et al. 2018a). Initially, there was an attempt to automatically derive a NoData mask from the existing map data, but the maps were not available nationwide, or the published era of the maps did not match that of the DEM. Thus, the mask was created manually by drawing polygons. This manual work accounted for most of the time required for processing in this study.
Certain areas were excluded from the automated classification, including manmade embankments that appear similar to terraces but have low ground strength and large areas that can affect clustering. The embankments were investigated using digital archives of topographic maps by GSI (around 1900, 1:50,000 to present, 1:25,000), the first color aerial photographs from the 1970s by GSI, polygon data of some manmade embankments in geological or geomorphological maps [“embankment, fill, and reclaimed land” in the seamless digital geological map of Japan v2 (1:200,000) (Geological Survey of Japan, AIST ed. 2019)]; “old water body” and “high embankment” in the vector tiles of the landform classification in GSI maps (GSI 2020), and color-shaded relief maps by GSI (GSI 2020). The colored image of HAND was also used to interpret high embankments along the coastlines, and the image of the slope gradient was used to interpret the line embankments of highways. The criteria for NoData were as follows:
-
The seabed is considered natural topography. Therefore, in reclaimed land, only the line embankments were considered NoData.
-
If the land is filled on a reclaimed land, the old one (the one in the 1900s) was not deemed NoData, but the new one was deemed NoData.
-
Seawalls, sea banks, and wharfs were deemed NoData.
-
Large line embankments, which can be seen in the image of the slope gradient (30 m grids), were deemed NoData. However, to reduce the workload, only representative highway fills and large river embankments were acquired.
-
Cuts and fills of inland emerging residential areas were not captured due to the lack of nationwide data.
The areas excluded from the automated classification as NoData covered approximately 1% of Japan.
2.4 Base classification using k-means clustering and thresholding
The high-resolution DEM sourced from LiDAR still retained a small amount of noise associated with agricultural flattening and manmade fills, even at 30 m resolution and after the exclusion of large fills set to be NoData areas. Since the cell-based classification revealed noise that became apparent in the process of spatial filtering (Fig. 4), the polygon-based classification was adopted after segmentation to offset the noise. The efficacy of using polygons, i.e., terrain or slope units, as a criterion for classification has been noted by a number of researchers (Alvioli et al. 2020). Considering the purpose of this study and the use of 30 m resolution DEMs, a terrain unit should be a landform pattern (Speight 1984) in the mountains; however, in the plains, a landform element should be bracketed. With an emphasis on their application in landform elements of the plains, lnHAND and lnSLOPE, which did not use large windows, were employed for segmentation in this study. The method of segmentation was the multiresolution segmentation (Baatz and Schäpe 2000), which provided a practical example of terrain classification (Drăguţ and Blaschke 2006).
Because of the impracticality of preparing training data and the fact that we need to classify all cells in the target area, the classification method in this study was chosen to be unsupervised. Supervised classification can never exceed the training data, i.e., expert-driven maps. A quantitative classification that excludes human subjectivity is necessary so that it does not remain in imperfect imitation of the expert-driven maps. However, there is a strong need to fill the gaps in existing expert-driven maps. The method of Iwahashi et al. (2018a), which created subclasses by a simple and reproducible unsupervised classification (converged k-means clustering) and grouping with expert-driven maps or thematic data, can be considered a compromise. This study basically followed the same idea.
Figure 7 shows an outline of the classification method. First, the logarithmic value of the first- or low-order derivatives (lnSLOPE, lnHAND) were calculated from the 30 m DEM, and area segmentation was performed nationwide using the multiresolution segmentation tool of eCognition (Trimble).

Outline of the classification method of this study
Next, the polygons were classified into 40 clusters by k-means clustering nationally using the average of the normalized lnSLOPE (ZlnSLOPE), normalized lnHAND (ZlnHAND), and normalized TEXTURE (ZTEXTURE) in the polygons, with the area of the polygons as the weight. The clustering was performed using SPSS (IBM). Although there can be many combinations of the geometric signatures for clustering, using the Kanto Plain as a test case (Iwahashi et al. 2018c), the combinations that expressed the landform elements of the floodplains such as natural levees and low terraces by trial and error were investigated, and finally the three among four were used for clustering. The other important candidate was the case of using all four parameters, including CONVEXITY. However, CONVEXITY was not used for the following reasons. The clustering results using all four parameters showed that natural levees were not classified well on the plains; owing to a problem with CONVEXITY’s large window size, the area at the foot of the mountain was classified as strong concave, in the same cluster as low wetlands. The number of classes of clustering was tested in five increments from 5 to 45. A plot of the number of classes versus the sum of residuals of squares (SSE) became a smooth curve and no inflection point was observed. Interpretation of general landform patterns was possible even with only approximately 15 clusters. However, in Japan, where the aforementioned needs exist, we were conscious of consistency with existing maps rather than assembling the method in a fully automated manner. We decided to create more clusters and later group them together. Finally, the number of classes was chosen to be 40, assuming that the valley bottom plains in mountainous areas could be extracted and that the final classification could be aggregated to approximately 12–20 classes. Figure 8 shows scatter plots of the convergence values for the 40 clusters. Based on these plots, grouping and reclassification were performed.

Scatter plots of the convergence values for 40 clusters. The scatter plots of ZlnHAND and ZTEXTURE, where ZlnSLOPE is represented by the color of the dots. The background gradient is a plot of the average value for each terrain unit expressed as a density distribution
Based on the frequency of recent floods, the lowlands near the water level were extracted separately using the values of lnHAND (≲ 0.03; this corresponds to the area where HAND is approximately 3 cm or less). This is the 41st category. The data including these 41 classes (Class41 in Fig. 7) were the base data of the next additional step, which is the grouping of the terrain unit.
2.5 Grouping of clusters and additional classification for a portion
The processes up to the previous section were fully automated, and the terrain classification could have ended there. However, as mentioned earlier, in the Japanese case study presented in this paper, we adopted the technique of creating many clusters and grouping them later. The results of grouping the clusters can vary arbitrarily depending on the reference data. In this study, grouping was performed to create a map, which resembles the expert-driven geomorphological maps of plains and terraces, while representing the vulnerability to slope failures in mountains.
The data listed in Table 2 were used as the thematic data of topography and geology related to ground zoning. A seamless digital geological map of Japan (SDGM) (Data No. 1 in Table 2), Japan engineering geomorphologic classification map (JEGM) (Data No. 2), and the GIS data of landform classification (Data No. 3) are available as reference materials of ground vulnerability and landform elements in plains. The expert-driven geomorphological maps (Data No. 2 and 3) were created by the manual interpretation of aerial photographs and investigation of soils, old topographic maps, documents of slope materials, and chronology. They focus on the landform classifications of the plains, not mountains and hills.
The landslide distribution maps (Data No. 4) have nationwide coverage; they illustrate old landslides with large landslide masses and do not include recent shallow landslides. Landslide inventories of shallow landslides in recent disasters were collected (Data No. 5–7). The inundation area data caused by Typhoon Hagibis (Data No. 8) were also collected.
Grouping of the automated terrain classes (enclosures in Fig. 7) was based on a comprehensive evaluation of the following information:
-
Cross-tabulation with Data No. 1 (aggregated by Iwahashi et al. 2018a)
-
Cross-tabulation with Data No. 2
-
Visual observation of the overlay with Data No. 3
-
Cross-tabulations with 371,732 center points of landslide masses of Data No. 4 (depending on the size of the landslide masses)
-
Cross-tabulation with 20,003 center points of landslide scarps of Data No. 5–7
The appendixes include scatterplots of all cross-tabulations (Appendix A: Data No. 1, Appendix B: Data No. 2, Appendix C: Data No. 4, and Appendix D: Data No. 5–7). The values of the density of units are represented by the symbols of the scatterplots in color gradients.
Figure 9 shows the cross-tabulation with aggregated geomorphological units (Data No. 2) in terms of symbols of pie charts with notes on the most frequent clusters for each geological unit (Data No. 1). Sedimentary rock or sediment younger than middle Miocene (blue letter “S” in Fig. 9), pyroclastic flow deposits (P), volcanic debris (VD), and Holocene tephra (T) are considered to be semi-consolidated or unconsolidated strata (Japan Society of Civil Engineers 2016). Other formations are considered as forming rock mountains. Since the map scale of Data No. 1 is very different from the 30 m resolution of the DEM, the positions of the foothills do not match the topographical representations, and hence, the cross-tabulation with Data No. 1 (Appendix A) contains considerable error. Since the resolution of Data No. 2 (250 m) is also coarser than the topographical representations of the 30 m DEM, the pie charts of Fig. 9 may include some errors. Figure 10 shows the cross-tabulation with the landslide distribution (Data No. 4) in terms of symbols of pie charts.

Cross-tabulation of 40 clusters with geomorphological units showing breakdowns. The geomorphological units were aggregated from data 2. Black letters are the cluster numbers. Blue letters are the abbreviation of each legend in data 1 and are written next to the most frequent cluster. (S: Sedimentary rock or sediment (younger than Middle Miocene), SR: Sedimentary rock or sediment (older than Middle Miocene), Pl(new): Plutonic rock (younger than middle Miocene), Pl(old): Plutonic rock (older than middle Miocene), A: Accretionary complex, Me: Metamorphic rock, P: Pyroclastic flow deposits, MV(new): Mafic volcanic rock (Holocene), MV(old): Mafic volcanic rock (older), FV: Felsic volcanic rock, VD: Volcanic debris, T: Holocene tephra, U: Ultramafic rock, FI: Felsic intrusive rock)

Cross-tabulation of 40 clusters with major landslides showing breakdowns. As locations of major landslides, we used 371,732 center points of landslide masses in data 4
The clusters would have been automatically grouped by machine learning using statistical data and cross-tabulated with topography-related themes (Iwahashi et al. 2018a). However, at a resolution of 30 m, on-site practical applications in engineering are on the horizon. For Japan, where some manual 1:25,000 scaled geomorphological maps exist, there is a strong need for users to have the classification results to fill in those maps as well. Therefore, the grouping was carried out by visual checking, and trial and error. For the mountainous areas where there were no existing legends, we designed them referring to the landslide inventories. The following constraints were attached to the groupings, instead of grouping the clusters completely randomly. Under the rule of placing adjacent clusters in the same group on the scatterplot and the policy of emphasizing the classification of basic landforms, the groups (Group_orig in Fig. 7) were defined as shown in the annotation in Fig. 11, considering the information in Appendix and the observations of grouping the trial results on the map.

Basic grouping and inferred terrain types of the clusters
The general tendencies that can be interpolated from the cross-tabulations are as follows: compared with the nationwide geological and geomorphological maps (Data No. 1 and 2), a high value of ZlnHAND indicates that the slope is in the higher range and a low value indicates that it is in the lower range; a high value of ZTEXTURE indicates that the slope lies on hard rock and a low value indicates that it is on unconsolidated strata or high permeability rock such as Holocene mafic volcanic rock.
The relationship between the ground characteristics and affiliation groups can be inferred from the cross-tabulations with the geological and geomorphological units (Appendixes A and B), and Fig. 9, except for Group 5. Groups 1 and 2 are both hard rock mountains; however, Group 2 is on lower slopes and may be more vulnerable than Group 1 based on comparisons with recent shallow landslides (Appendix D). Groups 8–14 are unconsolidated plateaus, terraces, and plains with few exceptions such as the rocky strath terraces, which are rare in Japan (approximately 0.5% by area ratio in JEGM (Data No. 2)), and manmade cuts. The other groups (Groups 3, 4, 6, and 7) are volcanoes and less robust mountains and hills. Higher slopes with low texture, Groups 6 and 7, which contain Holocene mafic volcanoes and ultramafic rock, may be related to high permeability or landslide susceptibility. Figure 10 indicates that large landslides occur occasionally on higher slopes.
The moderate mountains and hilly slopes were divided into Groups 3 and 4 to show the predominant areas of large and shallow landslides through comparisons with data 4–7 (Appendixes C and D, Fig. 10) for consistency in terms of geology and geomorphology. The locations of the shallow landslides that have occurred recently tend to vary by event and are likely to be influenced by topography more commonly in areas that suffer from heavy rainfall events or earthquakes. However, except for a landslide that occurred at a Holocene volcano (Appendix D; 2016 Kumamoto Earthquake hit the regions in and around Aso volcano in Kyushu), the landslides mostly occurred on intermediate slopes. Shallow landslides frequently occur on low, small, and uneven slopes. Group 4 is grouped to widely include several clusters that are prominent in shallow landslides (Appendix D). Group 4 likely coincides with the lower side slopes (Miyagi 1990) known for frequent shallow landslides in monsoon regions.
Although the characteristics of Group 5 could not be determined by cross-tabulation, Group 5 slopes, as observed on the maps, were common valleys in hard rock mountains. To investigate the valleys, we created Fig. 12, which shows the length of the drainage lines for Honshu Island in terms of the size of the square. There are three typical valley landforms found in the mountains: Group 4, 5, and 10. Group 5 is a valley commonly found on accretionary and granitic mountain bodies. Group 10 is distributed on the slopes of various lithologies but characterized by its prevalence in volcanic debris compared to Group 5. Group 10 is common in the downstream region of granite mountainous areas, although this is not reflected in the cross-tabulation of the geological map.

Length of the drainage lines for mountains and hills in Honshu Island with their geology. The drainage lines were extracted from the 30 m DEM and the same ones used to calculate HAND. The geological units found in the mountains (SEGM) were used for the cross-tabulation
To further understand the nature of each group, the classification map was analyzed. The investigation of the mountain bodies (ridge areas) from top to bottom showed that, depending on the lithology, there was a sequence of terrain groups that were clockwise and counterclockwise, starting with Groups 6 and 7 shown in Fig. 11. In the case of accretionary hard rock areas, which are the most common non-volcanic mountains in Japan, the narrow top crest slopes are sometimes formed in Groups 6 and 7, where gravity-deformed topography, such as double ridges and large landslide scarps, is often observed (Fig. 13a). In this type of mountain, Group 6 slopes lie lower and are occasionally distributed in valleys and are related to the presence of debris and landslide masses, suggesting an association with high permeability. Group 1 continues as the slope that characterizes these mountain slopes (sometimes without Groups 6 and 7). The sequence of the mountain bodies to plains is Group (7-6-)1-2-4-5-12-14, from top to bottom. Group 2 is the upper valley wall, Group 4 is the lower valley wall, and Group 5 is the valley floor. This sequence, which moves clockwise, is shown in Fig. 11. In these areas, there is a clear distinction between denudation or mass movement areas and sedimentation areas. Sedimentation areas are lower than those in Group 5. On the contrary, the slopes of the Quaternary mafic volcanoes such as Mt. Yatsugatake and Mt. Fuji are completely different, with Group 6 at the crest slopes and Group 7 below (Fig. 13b). The most common sequence of the volcanoes to plains in and around the Quaternary mafic volcanoes is Group 6-7-8-9-11-13-12-14 from top to bottom in the ridge area. This sequence of large slopes, which moves counterclockwise, is shown in Fig. 11. Group 11 and below are sedimentary areas. Large stratovolcanoes are carved into gully-like valleys, which have a quite different sequence to that of the ridges (Group 1-2-4-10-12-14 from top to bottom). Group 10 is prevalent in transition areas between erosional and sedimentary areas, such as debris flows, cliffs of terraces, and hilly terraces.

Portion of the classification in an accretionary hard rock area (a) and a volcano-dominated area (b). Location maps are included in Fig. 14. a The terrain classification from this study, a portion of Akaishi Mountains. b The southern portion of Mt. Yatsugatake and its surroundings. Mt. Yatsugatake is a large Quaternary complex volcano with a long period of activity. Basaltic andesite and pyroclastic rock of the Middle Pleistocene are distributed near the summit (2899 m), and volcanic rock of the Late Pleistocene is distributed to the north (Geological Survey of Japan, AIST (ed) 2019). Subdivision of Group 11 (a, b) is explained in the text
Other lithologies that cover a large area of mountains and hills are granite (western Japan and the east side of Tohoku), tertiary formations (west side of Tohoku), and pyroclastic plateaus (Kyushu). These areas, except for the fresh granite mountainous areas, are known to be prone to sediment disasters. Groups 3 and 4 are widely distributed in these areas, and Groups 6, 7, 1, and 2 are distributed on some mountain ridges. The granite mountains are characterized by the distribution of Groups 9 and 10 in downstream valleys and foothills, as well as in volcanic areas. Visual observation of landslide distribution maps (Table 2) indicates that Groups 6 and 7 in Tertiary formations are mostly landslide-associated slopes.
Based on the findings, the clusters near the upper left contour in Fig. 11 are presumed to be summit or crest slopes, and the clusters near the lower right contour are presumed to be lower slopes like valleys. Moderate slopes of mountains or hills that coincide with frequent small or shallow landslides are the ones that are actively dissecting (Fig. 11).
In the present method, CONVEXITY was not used for clustering because the top priority was given to the extraction of landform elements in the plains during the trial and error process. Therefore, Group_orig (Fig. 7) did not allow for the classification of terraces and fans. However, terraces and fans have different formation processes and should be separated. Thus, an additional classification was performed using CONVEXITY to classify them (threshold = 0.51).
The 41st category, the additional legend for the lowlands near the water level, was considered appropriate to be a separate group with similarities to the former lakes and tidal lowlands. Based on the interpretation of those sequences and cross-tabulations, the final terrain groups (Group_fin in Fig. 7) are described in Table 3.
3 Results and discussion
Figure 14 is a map showing the classification results for the major parts of Japan. Compared to the previous cell-based study (Iwahashi and Pike 2007), the approach in this study significantly improved the extraction of landform elements in the plains in 30 m DEMs, even in areas with a large population and manmade cuts and fills, such as the capital area (Fig. 15a). Since conventional classifications using slope gradient, surface texture, and local convexity could not depict the landform elements in the plain, the introduction of HAND delineated even low terraces and large natural levees. These data were useful to understand the general terrain classification of the area with no existing geomorphological maps (Fig. 15b).

Overview of the terrain classification of this study. This reference map has been reduced in resolution and does not show remote islands. The original map can be seen from the linked URL (https://gisstar.gsi.go.jp/Japan_terrain/). Black boxes show the locations of Figs. 13, 15, 16, and 17 and the graphical abstract

Comparison of the terrain classification of this study with other classifications. Legend of the current classification is the same as in Fig. 14. Location maps are included in Fig. 14. a The capital area, in comparison with the terrain classification by the method of Iwahashi and Pike (2007) and the expert-driven maps (the landform classification in Table 2; the legends are aggregated). Oblique lines in the terrain classification show the riverbeds. b Hokkaido, a similar set as a
Wakamatsu and Matsuoka (2013) found that the valley bottom lowland (the only legend for valleys in JEGM) is the unit with the largest error in estimating Vs30. The differences in the nature of the main valleys (Group 5 and 10) identified in this study will be useful in the classification of the legends, which are traditionally lumped together.
Landslides are widespread on mountain slopes but not abundant in Group 1. They are mainly distributed in Groups 2, 6, 3, and 4, and the groups were designed to reflect the differences in landslide size and location of occurrence. Large landslides and gravity-deformed topographies are distributed in large highland slopes (Groups 6 and 7), while smaller landslides are distributed in Group 2 on the upper valley wall or Groups 3 and 4 on the lower valley wall. The distribution of shallow landslides is predominant in Group 4 (light purple; Fig. 16a). The size distribution of landslides follows the power law (Chen et al. 2016; Tebbens 2020); the smaller the size, the more frequently it is likely to occur. Therefore, Group 4 indicates the frequent occurrence of small landslides. The slope widths of a single terrain group are variable; thus, a buffer analysis cannot be performed, but landslides are also common near the boundaries of different terrain groups (Fig. 16b).

Image overlays of shallow landslides caused by 2018 July heavy rainfalls. Legend of the classification is the same as in Fig. 14. Location maps are included in Fig. 14. The center points of shallow landslides (white circles) were interpolated by GSI (2018) using digital aerial photographs. a Around Uwajima, Ehime Prefecture. b Around Hiroshima, Hiroshima Prefecture
Since the flood areas depend on the condition of embankments, they do not necessarily correspond to the topography. However, the lowlands near the water level (an additional legend using the threshold of HAND; Group 16, blue) show good correspondence with the areas of floods (Fig. 17). The nature of Group 16 may help indicate areas where flood waters are likely to linger.

Image overlays of the area of floods caused by the 2019 Typhoon Hagibis. Legend of the current classification is the same as in Fig. 14. Location maps are included in Fig. 14. The areas of flood (black lines) were estimated by GSI (2019 Oct 18). a Around Yoshida River, Miyagi Prefecture. b Around Abukuma River, Miyagi Prefecture
The results of the terrain classification contain a few points for improvement. A few terrain units in this study have thin bridge-like polygons that are connected to each other. The manipulation of the shape parameter of the multiresolution segmentation did not improve the overall depiction of the boundaries of the landform elements due to the inferior depiction of the boundaries in exchange for the improvement of narrow bridge-like connections. Other methods such as the use of basin boundaries can be considered, but their use in terraces and plains is unsuitable for this comprehensive terrain classification from mountains to plains, because the boundaries of landform elements in terraces and plains depend on the geometric form of the terrain rather than the basin boundaries. Proper determination of the area of a terrain unit is very important for the quality of terrain classification. New methods, including different fields such as image classification, are required.
In this study, the effect of DEM unevenness was minimized. However, because NoData was not set for the cuts and fills of the residential areas, misclassifications were detected for residential areas with large manmade unevenness and agricultural plateaus. There were two cases in which manmade uneven areas in floodplains were misclassified as terraces (Group 11a), and manmade flattened areas on terraces were misplaced as slightly elevated areas in plains (Groups 11b, 13). Although there is no solution for these cases, since the data were created in polygons, it is relatively easy to fix them manually. In addition, the DEM generated from LiDAR data showed large riverbed unevenness that remained after being aggregated into a 30 m resolution grid, and they were often classified into the same group as terraces and fans (Fig. 15a). Whether this is a misclassification or a representation of gravelly or sandy ground conditions is debatable. In any case, since the data involve polygons, it is still relatively easy to fix the misclassification problem.
The upstream-to-downstream sequence of the ridges in the terrain classification map showed that the sequence of the terrain groups may be different among different lithologies. Therefore, we can infer the formation process of landforms by investigating the sequence of terrain groups rather than regarding them as independent polygons, and the formation process can be incorporated into the automatic classification of topography using DEMs. Such a computationally expensive analysis can be performed using GIS, which is a subject for future research.
The availability of quantitatively zoned data on topography will allow for interpolation and mapping of a variety of materials with known correlations to topography. The map data of the terrain classification or the clusters before grouping would be useful for such a task. From the linked URL (https://gisstar.gsi.go.jp/Japan_terrain/), a shape file that includes polygon attributes (Table 1), the original cluster number (Cluster40 in Fig. 7), and intermediate groups (Class41 and Group_orig in Fig. 7) with the final terrain group (Table 3; Group_fin in Fig. 7) is published.
3.1 Adaptation outside Japan
To determine the applicability of the method developed in this study to other locations, we performed automated terrain classification of California using a 30 m DEM interpolated from the United States Geological Survey (USGS) National Elevation Dataset (NED) 1″ DEMs (Fig. 18). The data (Fig. 18) were generated using the same set of topographic measurements computed with the same window sizes and thresholds as that of the Japanese classification. Due to the lack of information, masks were not used to cut the manmade terrain portions of the DEM. Instead of classifying the terrains into 40 classes, we classified them into 15 classes by the process of k-means clustering (corresponds to Cluster_orig in Fig. 7). The classification was completed by adding the lowlands near water level (Fig. 7) as a 16th category. No grouping was done; hence, it is a fully automatic classification. Figure 19d shows an enlarged view of the classification of Los Angeles and its suburbs and associated data. The differences in the sources of DEMs in this region cause unevenness in texture; therefore, the cell-based method of Iwahashi and Pike (2007) (Fig. 19b) reveals source differences (Fig. 19a) in plains. However, the method developed in this study (Fig. 19d) succeeded in extracting the landform elements of the plains to some extent, and the results agree with the geological map (Wills et al. 2015; Fig. 19c). Therefore, this method can be effectively used for regions other than Japan by customizing the grouping and is useful for supplementing data in areas without geomorphological maps.

Terrain classification of California using a 30 m DEM. The DEM was generated from 1" DEMs of the NED. No manmade terrain masks were used. The number of clusters is 15 and no grouping or reclassification was performed except for the addition of lowlands near the water level (blue). The other processes are the same as those in the Japanese data

Terrain classification of the Los Angeles area and related information. The location map is included in Fig. 18. a Types of the production method of the DEMs (NED). DLG2DEM: simple linear interpolation from contours; LT4X: complex linear interpolation from contours, often including hydrography; Lidar: airborne LiDAR. b Terrain classification using the method of Iwahashi and Pike (2007). c Geological map (Wills et al. 2015). d A portion of Fig. 18
4 Conclusions
A semi-automated classification of topography was conducted using a 30 m resolution DEM of Japan with a new classification method. The overview of the process is as follows:
-
(1)
Generation of the raster images by topographic measurements using the DEM
-
(2)
Segmentation of the terrain units
-
(3)
Clustering using representative values of topographic measurements for each unit
-
(4)
Grouping of the clusters according to the purpose
In this study, in process 1, slope gradient, HAND, surface texture, and local convexity were calculated, and the latter parameters were devised to eliminate the noise and unevenness of the DEM caused by manmade embankments or differences in the DEM sources. In process 2, multiresolution segmentation was carried out using the slope gradient and HAND. In process 3, mean values were used and the slope units were classified by k-means clustering. In process 4, the objective was to develop a classification method that can distinguish the landform elements even in urban plains, and in which geomorphological and geoengineering classifications coexist without large contradictions, such that the classification of topography reflects the ground vulnerability of both alluvial plains and mountains. Then, we generated a classification of topography with even accuracy throughout Japan. This map shows similarities to expert-driven geomorphological maps and provides a meaningful overlay with areas where shallow landslides and floods have occurred recently. The experiment in California indicates that this method is also useful in other locations. Although there is room for improvement in these processes, the results were satisfactory overall. The availability of quantitatively zoned data on topography will allow for interpolation and mapping of a variety of materials with known correlations to topography.
Availability of data and materials
The dataset supporting the conclusions of this article is available at https://gisstar.gsi.go.jp/Japan_terrain/, which is a website for viewing and downloading the results of terrain classification.
Change history
02 March 2021
A Correction to this paper has been published: https://doi.org/10.1186/s40645-021-00412-z
Abbreviations
- DEM:
-
Digital elevation model
- DID:
-
Densely inhabited district
- FGD:
-
Fundamental geospatial data
- GIS:
-
Geographic information system
- GSI:
-
Geospatial Information Authority of Japan
- GSJ:
-
Geological Survey of Japan, AIST
- HAND:
-
Height above the nearest drainage
- JEGM:
-
Japan engineering geomorphologic classification map
- LiDAR:
-
Light detection and ranging
- NIED:
-
National Research Institute for Earth Science and Disaster Resilience
- SDGM:
-
Seamless digital geological map of Japan
References
Alvioli M, Guzzetti F, Marchesini I (2020) Parameter-free delineation of slope units and terrain subdivision of Italy. Geomorphology 358:107124. https://doi.org/10.1016/j.geomorph.2020.107124
Baatz, M, Schäpe, A (2000) Multiresolution segmentation: an optimization approach for high quality multi-scale image segmentation. Proceedings of Angewandte Geographische Informationsverarbeitung XII:12-23
Chen C, Oguchi T, Hayakawa YS, Saito H, Chen H (2016) Relationship between landslide size and rainfall conditions in Taiwan. Landslides 14:1235–1240. https://doi.org/10.1007/s10346-016-0790-7
Deng Y, Wilson JP, Bauer BO (2007) DEM resolution dependencies of terrain attributes across a landscape. Int J Geogr Inf Sci 21:187–213. https://doi.org/10.1080/13658810600894364
Dikau R, Brabb EE, Mark RM (1991) Landform classification of New Mexico by computer. US Geol Surv Open-File Rep:91–634. https://doi.org/10.3133/ofr91634
Drăguţ L, Blaschke T (2006) Automated classification of landform elements using object-based image analysis. Geomorphology 81:330–344. https://doi.org/10.1016/j.geomorph.2006.04.013
Drăguţ L, Eisank C (2012) Automated object-based classification of topography from SRTM data. Geomorphology 141-142:21–33. https://doi.org/10.1016/j.geomorph.2011.12.001
European Commission – DG JRC (2008) Global landform classification. https://esdac.jrc.ec.europa.eu/content/global-landform-classification. Accessed 2 Dec 2020
Geological Survey of Japan, AIST (ed) (2015) Seamless digital geological map of Japan 1: 200,000. May 29, 2015 version. Geological Survey of Japan, National Institute of Advanced Industrial Science and Technology.
Geological Survey of Japan, AIST (ed) (2019) Seamless digital geological map of Japan 1: 200,000 V2. June 5, 2019 version. Geological Survey of Japan, Tsukuba, National Institute of Advanced Industrial Science and Technology. https://gbank.gsj.jp/seamless/index.html?lang=ja&p=agreement.
Geospatial Information Authority of Japan (2016) Landslide inventory of the 2016 Kumamoto earthquake. https://www.gsi.go.jp/BOUSAI/H27-kumamoto-earthquake-index.html#cc. Accessed 2 Dec 2020 (in Japanese)
Geospatial Information Authority of Japan (2018) Landslide inventory of the July 2018 heavy rainfalls. https://www.gsi.go.jp/BOUSAI/H30.taihuu7gou.html. Accessed 2 Dec 2020 (in Japanese)
Geospatial Information Authority of Japan (2019) Estimated inundation areas caused by the 2019 Typhoon Hagibis. https://www.gsi.go.jp/BOUSAI/R1.taihuu19gou.html#11. Accessed 2 Dec 2020 (in Japanese)
Geospatial Information Authority of Japan (2020) The GSI Maps. https://maps.gsi.go.jp. Accessed 18 June 2020 (in Japanese) (Regularly updated)
Hengl T, Mendes de Jesus J, Heuvelink GBM, Ruiperez Gonzalez M, Kilibarda M, Blagotić A, Wei S, Wright MN, Xiaoyuan G, Bauer-Marschallinger B, Guevara MA, Vargas R, MacMillan RA, Batjes NH, Leenaars JGB, Ribeiro E, Wheeler I, Mantel S, Kempen B (2017) SoilGrids250m: global gridded soil information based on machine learning. Plos One 12:e0169748. https://doi.org/10.1371/journal.pone.0169748
Irsyam M, Asrurifak M, Mikhail R, Wahdiny II, Rustiani S, Munirwansyah M (2017) Development of nationwide Vs30 map and calibrated conversion table for Indonesia using automated topographical classification. J Eng Tech Sci 49:457–471. https://doi.org/10.5614/j.eng.technol.sci.2017.49.4.3
Iwahashi J, Kamiya I, Matsuoka M, Yamazaki D (2018a) Global terrain classification using 280 m DEMs: segmentation, clustering, and reclassification. Prog Earth Planet Sci \. doi:https://doi.org/10.1186/s40645-017-0157-2 (GIS data available via https://gisstar.gsi.go.jp/terrain2018/. Accessed 2 Dec 2020)
Iwahashi J, Kamiya I, Yamagishi H (2012) High-resolution DEMs in the study of rainfall-and earthquake-induced landslides: use of a variable window size method in digital terrain analysis. Geomorphology 153:29–38. https://doi.org/10.1016/j.geomorph.2012.02.002
Iwahashi J, Matsushi Y, Fukuoka H (2015) Digital terrain analysis of sea-land combined data on the Outer Zone of Southwest Japan including the Nankai Trough. Disaster Prev Res Inst Annu B 58:102–115
Iwahashi J, Nakano T, Yamazaki D (2018b) Classification of topography in artificially modified alluvial plains using DEMs. https://doi.org/10.29007/g4hx
Iwahashi J, Pike RJ (2007) Automated classification of topography from DEMs by an unsupervised nested-means algorithm and a three-part geometric signature. Geomorphology 86:409–440. https://doi.org/10.1016/j.geomorph.2006.09.012 (GIS data available via https://www.gsi.go.jp/chirijoho/chirijoho-e31004.html. Accessed 2 Dec 2020)
Iwahashi J, Yamazaki D, Herrick J, Yong A, Matsuoka M, Nakano T, Mital U, Savvaids A (2018c) Development of terrain classifications as a proxy to estimate VS30. Abstract EP53E-1934 presented at the AGU Fall Meeting 2018, Washington D.C., United States, 10-14 December 2018. https://agu.confex.com/agu/fm18/meetingapp.cgi/Paper/389196. Accessed 2 Dec 2020
Japan Meteorological Agency (2020) Past weather data search. http://www.data.jma.go.jp/obd/stats/etrn/index.php. Accessed 2 Dec 2020 (in Japanese)
Japan Society of Civil Engineers (2016) Standard specifications for tunneling—2016, mountain tunnels. Maruzen Publishing Co. Ltd, Tokyo (in Japanese)
Jasiewicz J, Stepinski TF (2013) Geomorphons — a pattern recognition approach to classification and mapping of landforms. Geomorphology 182:147–156. https://doi.org/10.1016/j.geomorph.2012.11.005
Liu YY, Maidment DR, Tarboton DG, Zheng X, Yildirim A, Sazib NS, Wang S (2016) A CyberGIS approach to generating high-resolution height above nearest drainage (HAND) raster for national flood mapping. CyberGIS 16, Third International Conference on CyberGIS and Geospatial Data Science, Urbana, Illinois, July 24-26. doi:10.13140/RG.2.2.24234.41925/1
MacMillan RA, Martin TC, Earle TJ, McNabb DH (2003) Automated analysis and classification of landforms using high-resolution digital elevation data: applications and issues. Can J Remote Sens 29:592–606. https://doi.org/10.5589/m03-031
MacMillan RA, Pettapiece WW, Nolan SC, Goddard TW (2000) A generic procedure for automatically segmenting landforms into landform elements using DEMs, heuristic rules and fuzzy logic. Fuzzy Sets Syst 113:81–109. https://doi.org/10.1016/S0165-0114(99)00014-7
MacQueen JB (1967) Some methods for classification and analysis of multivariate observations. In: Proceedings of 5-th Berkeley Symposium on Mathematical Statistics and Probability, Berkeley, University of California Press 1:281-297
Marr D, Hildreth E (1980) Theory of edge detection. Proc Royal Soc B 207:187–217. https://doi.org/10.1098/rspb.1980.0020
Matsunaga K, Matsuda R, Matsuo T, Watanabe I (2019) The 2016 Kumamoto Earthquakes landslide disasters and response. Int J Erosion Control Eng 11(4):131–137
Meybeck M, Green P, Vörösmarty C (2001) A new typology for mountains and other relief cases: an application to global continental water resources and population distribution. Mt Res Dev 21:34–45. https://doi.org/10.1659/0276-4741(2001)021[0034:ANTFMA]2.0.CO;2
Miyagi T (1990) Preliminary study of landform classification for sustainable land conservation in the Mahabharat Lekh, Nepal. Science Reports of Tohoku University, 7th series, Geology 40:71-85
Mori F, Mendicelli A, Moscatelli M, Romagnoli G, Peronace E, Naso G (2020) A new Vs30 map for Italy based on the seismic microzonation dataset. Eng Geol 275:105745. https://doi.org/10.1016/j.enggeo.2020.105745
Mulder VL, Bruin S, Schaepman ME, Mayr TR (2011) The use of remote sensing in soil and terrain mapping – a review. Geoderma 162:1–19. https://doi.org/10.1016/j.geoderma.2010.12.018
National Research Institute for Earth Science and Disaster Resilience (NIED) (2015) Digital archive for landslide distribution maps. https://dil-opac.bosai.go.jp/publication/nied_tech_note/landslidemap/gis.html. Accessed 5 June 2020
NHK WORLD-JAPAN (2019) Typhoon Hagibis Aftermath. https://www3.nhk.or.jp/nhkworld/en/news/special/typhoon201919/. Accessed 2 Dec 2020
Oguchi T, Saito K, Kadomura H, Grossman M (2001) Fluvial geomorphology and paleohydrology in Japan. Geomorphology 39:3–19. https://doi.org/10.1016/S0169-555X(01)00048-4
Okada N, Ye T, Kajitani Y, Shi P, Tatano H (2011) The 2011 Eastern Japan Great Earthquake disaster: overview and comments. Int J Disaster Risk Sci. 2(1):34–42. https://doi.org/10.1007/s13753-011-0004-9
Parker GA, Harmon JA, Stewart JP, Hashash YMA, Kottke AR, Rathje EM, Silva WJ, Campbell KW (2017) Proxy-based Vs30 estimation in Central and Eastern North America. Bull Seismol Soc Am 107:117–131. https://doi.org/10.1785/0120160101
Pelletier JD (2013) A robust, two-parameter method for the extraction of drainage networks from high-resolution digital elevation models (DEMs): evaluation using synthetic and real-world DEMs. Water Resour Res 49:75–89. https://doi.org/10.1029/2012WR012452
Pike RJ (1988) The geometric signature: quantifying landslide-terrain types from digital elevation models. Math Geo 20:491–511. https://doi.org/10.1007/BF00890333
Prima ODA, Echigo A, Yokoyama R, Yoshida T (2006) Supervised landform classification of Northeast Honshu from DEM-derived thematic maps. Geomorphology 78:373–386. https://doi.org/10.1016/j.geomorph.2006.02.005
Rennó CD, Nobre AD, Cuartas LA, Soares JV, Hodnett MG, Tomasella J, Waterloo MJ (2008) HAND, a new terrain descriptor using SRTM-DEM: mapping terra-firme rainforest environments in Amazonia. Remote Sens Environ 112:3469–3481. https://doi.org/10.1016/j.rse.2008.03.018
Reuter HI, Wendroth O, Kersebaum KC (2006) Optimisation of relief classification for different levels of generalization. Geomorphology 77:79–89. https://doi.org/10.1016/j.geomorph.2006.01.001
Saadat H, Bonnell R, Sharifi F, Mehuys G, Namdar M, Ake-Ebrahim S (2008) Landform classification from a digital elevation model and satellite imagery. Geomorphology 100:453–464. https://doi.org/10.1016/j.geomorph.2008.01.011
Saito H, Korup O, Uchida T, Hayashi S, Oguchi T (2014) Rainfall conditions, typhoon frequency, and contemporary landslide erosion in Japan. Geology 42:999–1002. https://doi.org/10.1130/G35680.1
Sato HP, Sekiguchi T, Kojiroi R, Suzuki Y, Iida M (2005) Overlaying landslides distribution on the earthquake source, geological and topographical data: the Mid Niigata prefecture earthquake in 2004, Japan. Landslides 2:143–152. https://doi.org/10.1007/s10346-005-0053-5
Sayre R, Dangermond J, Frye C, Vaughan R, Aniello P, Breyer S, Cribb D, Hopkins D, Nauman R, Derrenbacher W, Wright D, Brown C, Convis C, Smith J, Benson L, VanSistine DP, Warner H, Cress J, Danielson J, Hamann S, Cecere T, Reddy A, Burton D, Grosse A, True D, Metzger MJ, Hartmann J, Moosdorf N, Dürr HH, Paganini M et al (2014) A new map of global ecological land units—an ecophysiographic stratification approach. Association of American Geographers, Washington, DC ISBN 978-0-89291-276-6
Speight JG (1984) Landform. In: McDonald RC, Isbell RF, Speight JG, Walker J, Hopkins MS (eds) Australian soil and land survey field handbook. Inkata Press, Melbourne, pp 8–43
Suzuki T (1997) Introduction to map reading for civil engineers. In: Geomorphological basis for map reading, vol. 1, Kokon-shoin, Tokyo ISBN-13 978-4772250061 (in Japanese)
Tarboton DG (1997) A new method for the determination of flow directions and upslope areas in grid digital elevation models. Water Resour Res 33:309–319. https://doi.org/10.1029/96WR03137
Tarboton DG (2005) Terrain analysis using digital elevation models (TauDEM). http://www.faculty.umb.edu/david.tenenbaum/eeos383/taudem.html. Accessed 2 Dec 2020
Tebbens SF (2020) Landslide scaling: a review. Earth Space Sci 7:e2019EA000662. https://doi.org/10.1029/2019EA000662
Wakamatsu K, Matsuoka M (2013) Nationwide 7.5-arc-second Japan engineering geomorphologic classification map and Vs30 zoning. J Disaster Res 8:904–911. https://doi.org/10.20965/jdr.2013.p0904
Wakita K (2013) Geology and tectonics of Japanese islands: a review – the key to understanding the geology of Asia. J Asian Earth Sci 72:75–87. https://doi.org/10.1016/j.jseaes.2012.04.014
Wang F, Wu YH, Yang H, Tanida Y, Kamei A (2015) Preliminary investigation of the 20 August 2014 debris flows triggered by a severe rainstorm in Hiroshima City, Japan. Geoenvironmental Disasters 2:17. https://doi.org/10.1186/s40677-015-0025-6
Wills CJ, Gutierrez CI, Perez FG, Branum DM (2015) A next generation Vs30 map for California based on geology and topography. Bull Seismol Soc Am 105:3083–3091. https://doi.org/10.1785/0120150105
Yamagishi H, Iwahashi J (2020) Topographic and geological analyses of the coseismic landslides using GIS. In: Coseismic landslides. Hokkaido University Press, Sapporo (in Japanese) (in print)
Yamazaki D, Togashi S, Takeshima A, Sayama T (2018) High-resolution flow direction map of Japan. J Jpn Soc Civil Eng (B1) 74(5):I_163–I_168. https://doi.org/10.2208/jscejhe.74.5_I_163 (In Japanese)
Yong A, Hough SE, Iwahashi J, Braverman A (2012) A terrain-based site-conditions map of California with implications for the contiguous United States. Bull Seismol Soc Am 102:114–128. https://doi.org/10.1785/0120100262
Zhang W, Montgomery DR (1994) Digital elevation model grid size, landscape representation, and hydrologic simulations. Water Resour Res 30:1019–1028. https://doi.org/10.1029/93WR03553
Acknowledgements
We thank Masashi Matsuoka of Tokyo Institute of Technology, Alan Yong and Julie Herrick of USGS for their helpful comments about the relationship between Vs30 and landform, or the geography of California. We are grateful to the anonymous reviewers and editors for their sincere opinions and fruitful suggestions.
Funding
This work was supported by JSPS KAKENHI Grant Number JP18H00769.
Author information
Authors and Affiliations
Contributions
JI proposed the topic, conceived and designed the study, and developed and analyzed the data on terrain classification. DY aggregated and prepared the 30 m DEM. TN and RE collaborated with the corresponding author in the construction of the manuscript. All authors read and approved the final manuscript.
Authors’ information
JY, TN, and RE are staff of the Geographic Information Analysis Research Division at the Geography and Crustal Dynamics Research Center of GSI (https://www.gsi.go.jp/cais/geoinfo-index-e.html). DY is an associate professor at the Institute of Industrial Science, University of Tokyo (http://hydro.iis.u-tokyo.ac.jp/~yamadai/).
Corresponding author
Ethics declarations
Competing interests
The authors declare that they have no competing interests.
Additional information
Publisher’s Note
Springer Nature remains neutral with regard to jurisdictional claims in published maps and institutional affiliations.
Supplementary Information
Rights and permissions
Open Access This article is licensed under a Creative Commons Attribution 4.0 International License, which permits use, sharing, adaptation, distribution and reproduction in any medium or format, as long as you give appropriate credit to the original author(s) and the source, provide a link to the Creative Commons licence, and indicate if changes were made. The images or other third party material in this article are included in the article's Creative Commons licence, unless indicated otherwise in a credit line to the material. If material is not included in the article's Creative Commons licence and your intended use is not permitted by statutory regulation or exceeds the permitted use, you will need to obtain permission directly from the copyright holder. To view a copy of this licence, visit http://creativecommons.org/licenses/by/4.0/.
About this article

Cite this article
Iwahashi, J., Yamazaki, D., Nakano, T. et al. Classification of topography for ground vulnerability assessment of alluvial plains and mountains of Japan using 30 m DEM. Prog Earth Planet Sci 8, 3 (2021). https://doi.org/10.1186/s40645-020-00398-0
Received:
Accepted:
Published:
DOI: https://doi.org/10.1186/s40645-020-00398-0