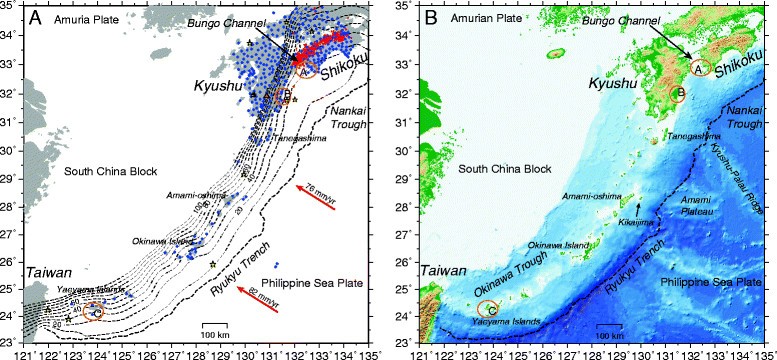
Figure 1
From: Short-term slow slip events along the Ryukyu Trench, southwestern Japan, observed by continuous GNSS

Map of the area studied along the Ryukyu Trench. (A) GNSS stations used along the Ryukyu Trench. Blue dots indicate used GNSS (GEONET) stations. Red dots are epicenters of low-frequency earthquakes (LFEs) determined by the Japan Meteorological Agency. Yellow stars indicate epicenters of large earthquakes whose coseismic displacements were removed from the analysis. The orange triangle indicates the location of the Kirishima volcano. Broken lines are isodepth contours of the subducting Philippine Sea Plate with a contour interval of 10 km. Red arrows indicate motion of the Philippine Sea Plate relative to that of the South China Block (Sella et al. [2002]). (B) Bathymetry along the Ryukyu Trench.